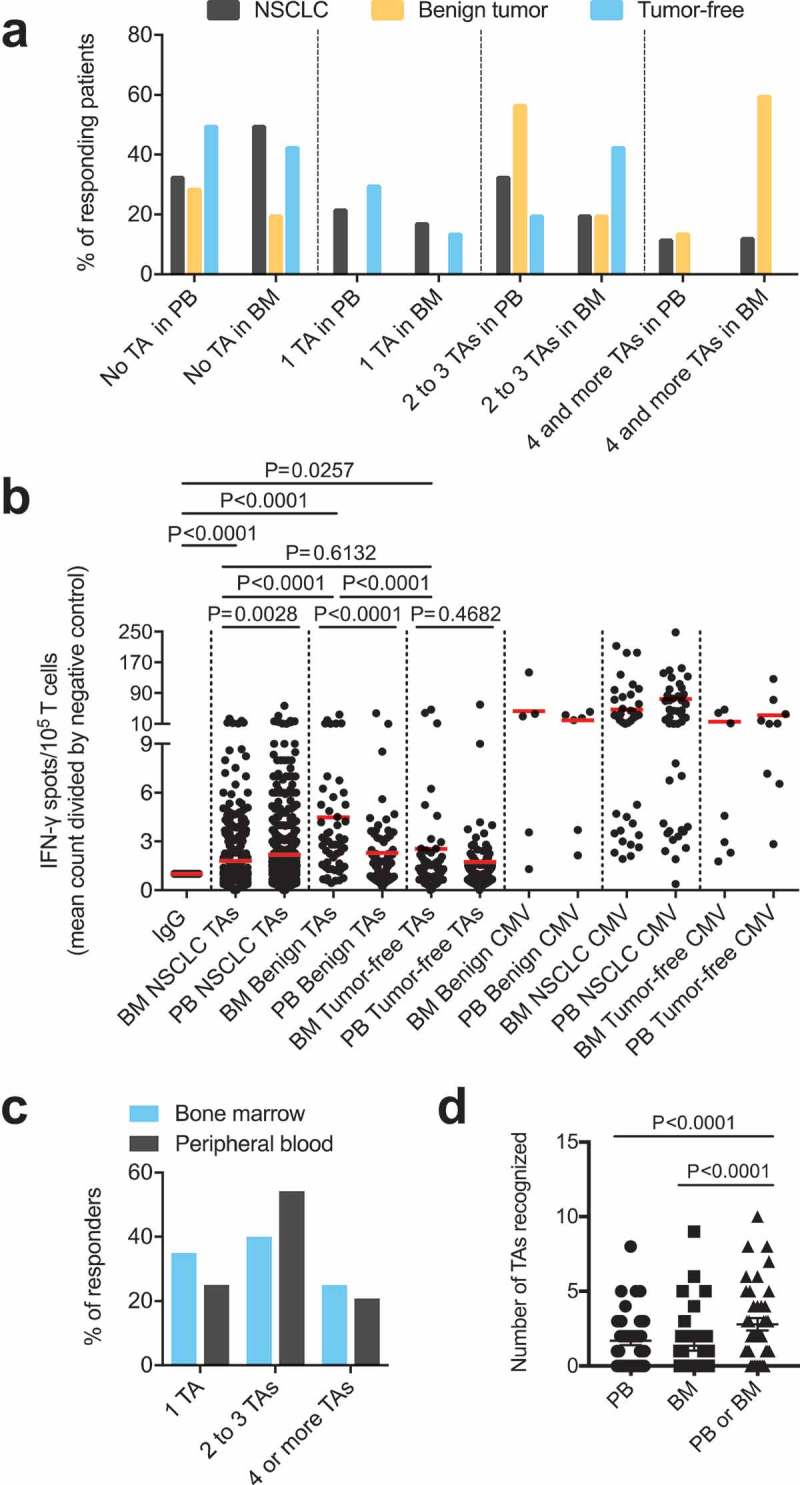
Figure 1.

(A) Response rates of PBTCs (PB samples available from n = 51 patients) and BMTCs (BM samples available from n = 39 patients) to TAs in the patients with NSCLC or benign tumors or tumor-free patients categorized by the number of different TAs recognized, as determined using the ELISPOT assay. (B) Higher frequencies of TA-specific TCs were observed in the PB than in the BM in NSCLC patients. The fold increase was calculated by comparing the mean IFN-γ spot count with the count of the IgG controls for all TA-containing wells used to assess samples from the patients with NSCLC or benign tumors or tumor-free patients with ELISPOT. P-values were determined using two-tailed Mann-Whitney and Wilcoxon matched-pairs signed rank tests. (C) – (D) Data from the 39 patients with PB and corresponding BM samples illustrating the response rate in responders alone, as determined using the ELISPOT assay (C), and the total number of TAs recognized per patient in the different compartments (D). (A) – (D) For a better visualization of TC responsiveness in BM versus PB, we show PB data that were published in our previous study.8 P-values were determined using two-tailed Wilcoxon matched-pairs signed rank tests. Ad/CMV, adenovirus/cytomegalovirus; BM, bone marrow; ELISPOT, enzyme-linked immunospot; PB, peripheral blood; PBTCs, peripheral blood-derived T cells; TA, tumor-associated antigen.
