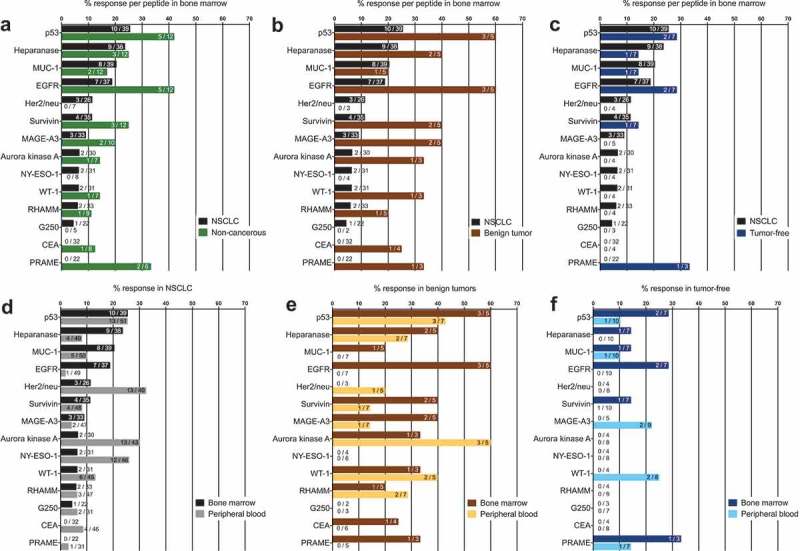
Figure 2.

(A) – (C) Response rates for each of the 14 TA-specific peptides in the BM from the patients with NSCLC compared with those for patients with benign tumors or tumor-free patients. (D) – (F) Response rates for each of the 14 TA-specific peptides in the PB and BM from the patients with NSCLC or benign tumors or the tumor-free patients. Numerical data “X/Y” indicate the number of patients with PBTCs responding to a particular TA (X) relative to the total number of patients tested for TA responsiveness (Y). (D) – (F) For a better visualization of TC responsiveness in BM and PB, we show PB data that were published in our previous study.8.
