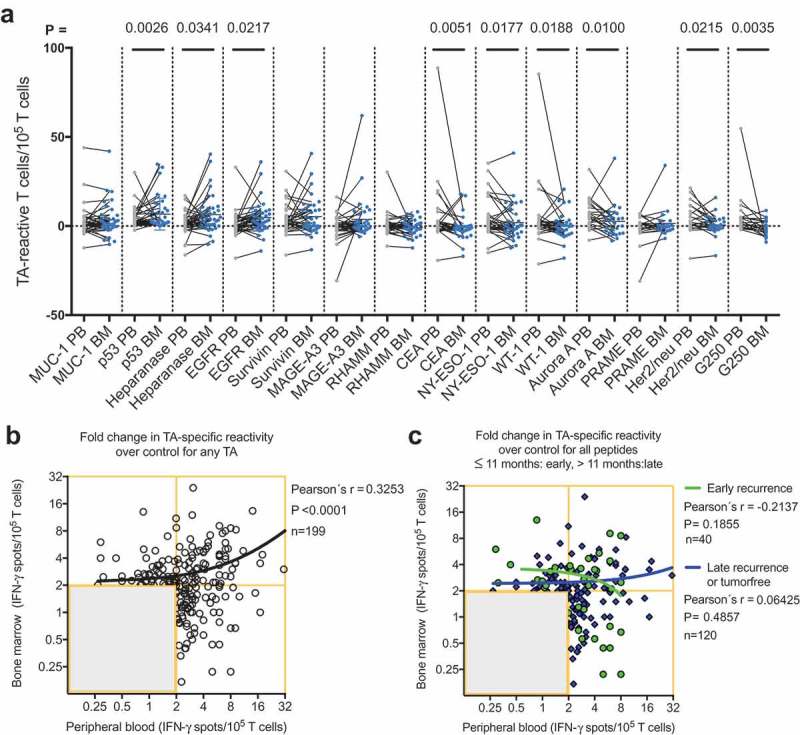
Figure 3.

(A) Responses of PBTCs (gray points) and the corresponding BMTCs (blue points) from 39 patients with NSCLC to any of the 14 tested NSCLC-associated antigens. The gray line between two points indicates the TA-specific spot counts of the PBTCs and BMTCs from the same patient. The mean TA-specific IFN-γ spot counts minus the mean IgG (negative control) IFN-γ spot counts are shown. P-values were determined using two-tailed Wilcoxon matched-pairs signed rank tests. For a better visualization of TC responsiveness in BM and PB, we show PB data that were published in our previous study.8 (B) Scatterplot showing the cumulative BMTC data in relation to PBTC responsiveness to any of the 14 tested TAs in 39 patients with NSCLC. BMTC responsiveness increased as PBTC responsiveness increased (two-tailed p < .0001, Pearson’s correlation coefficient r = 0.325, R2 = 0.106). (C) We defined early recurrence as tumor recurrence within 11 months after surgery.4 Scatterplot showing the cumulative BMTC data in relation to PBTC responsiveness to any of the 14 tested TAs in the patients with NSCLC recurrence following curative intent surgery within 11 months postsurgery (defined as early recurrence) compared with >11 months postsurgery (defined as late recurrence or tumor-free). The linear regression line of the patients with early recurrence (green line) was not significantly different from the linear regression line of the patients with late recurrence or tumor-free patients (blue line). (B) – (C) The frequencies of TA-specific TCs are shown as the fold increases in the mean TA-specific IFN-γ spot counts (calculated relative to the mean IgG control spot counts). The values in the lower left quadrants were not considered TA-specific responses and were excluded (n = 238 in (B) and n = 278 in (C)) from the regression analysis. Only the TC responses of 2 or more IFN-γ spot counts greater than the mean IgG control spot counts (n = 199 in (B) and n = 160 in (C)) were deemed positive and included in the regression analysis. The black line represents the linear regression line. BMTCs, bone marrow-derived T cells; NSCLC, non-small-cell lung cancer; PBTC, peripheral blood-derived T cell; TA, tumor-associated antigen.
