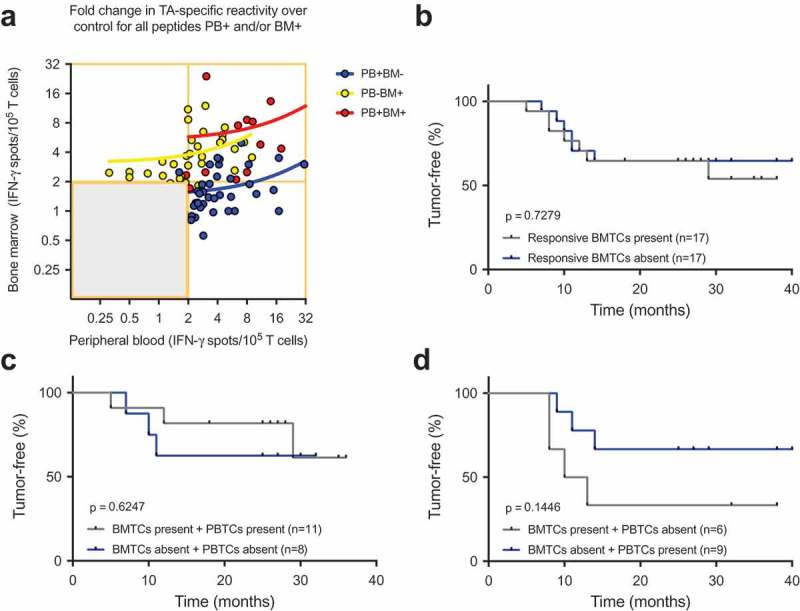
Figure 4.

(A) Cumulative BMTC data in relation to PBTC responsiveness in the patients with TA-specific responses in the PB but not in the BM (PB+BM-; blue line; Pearson’s correlation coefficient r = 0.333, R2 = 0.111, p = .033, n = 41) compared with patients with TA-specific responses in the BM but not the PB (PB-BM+; yellow line; Pearson’s correlation coefficient r = 0.266, R2 = 0.071, p = .122, n = 35) or patients with TA-specific responses in the PB and BM (PB+BM+; red line; Pearson’s correlation coefficient r = 0.433, R2 = 0.187, p = .140, n = 13). The frequencies of TA-specific TCs are shown as the fold increases in the mean TA-specific IFN-γ spot counts (calculated relative to the mean IgG control spot counts). TA-specific responsiveness was tested against 14 TAs in patients with NSCLC. RFS was not different between the patients with NSCLC with or without preoperative TA-responsive BMTCs. (B). Survival curves are plotted for all four scenarios of present/absent TA-specific BMTCs and PBTCs. (C) – (D). Patients were classified as TA responders when the triplicate IFN-γ spot counts for a specific peptide were significantly different from the counts for the IgG control peptide (p-value<0.05 by a t-test). Kaplan-Meier survival curves were compared using the log-rank test (B) – (D). TA-specific responsiveness to 14 TAs was assessed in patients with NSCLC. BMTC, bone marrow-derived T cell; NSCLC, non-small-cell lung cancer; PBTC, peripheral blood-derived T cell; RFS, recurrence-free survival; TA, tumor-associated antigen.
