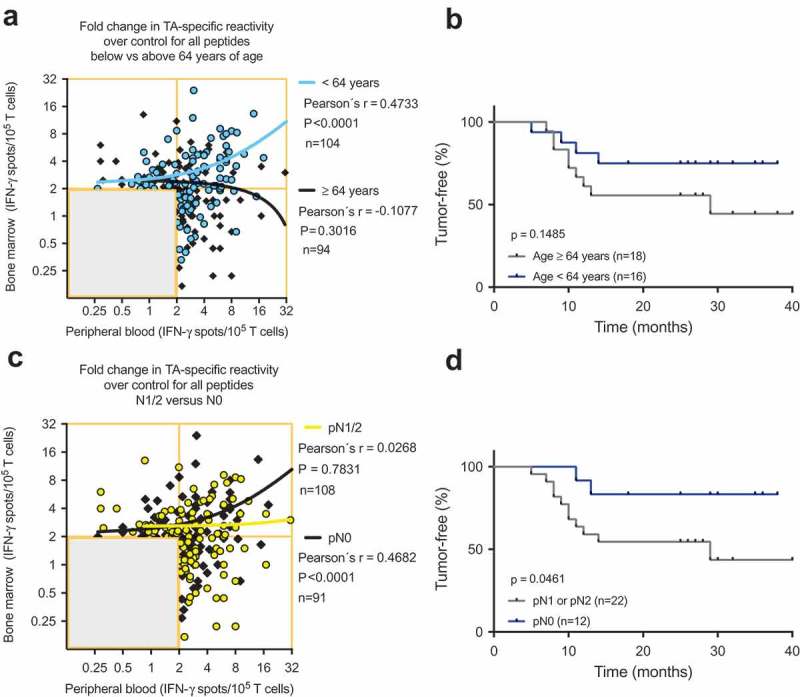
Figure 5.

(A) and (C) Scatterplots showing the cumulative BMTC data in relation to PBTC responsiveness to any of the 14 tested TAs in patients with NSCLC (A) younger than 64 years and patients older than 63 years and (C) in patients with pathologically confirmed lymph node metastasis in the final pathology assessment (yellow linear regression line) compared with patients with no lymph node metastasis (black linear regression line). (A) Linear regression analyses showed a statistically significant difference between the slopes (p < .001). In the patients younger than 64 years, BMTC responsiveness increased as PBTC responsiveness increased (two-tailed p < .0001, Pearson’s correlation coefficient r = 0.456, R2 = 0.208). (C) Linear regression analyses showed a statistically significant difference between the slopes (p = .003). In the patients with no lymph node metastasis, BMTC responsiveness increased as PBTC responsiveness increased (two-tailed p < .0001, Pearson’s correlation coefficient r = 0.468, R2 = 0.219). (A) and (C) The frequencies of TA-specific TCs are shown as the fold increase in the mean TA-specific IFN-γ spot counts (calculated relative to the mean IgG control spot counts). The values in the lower left quadrants were excluded, n = 240 in (A) and n = 239 in (C). (B) and (D) Kaplan-Meier survival curves suggested (B) improved RFS in the younger patients (blue) compared with patients older than 63 years of age (gray) and (D) improved RFS in the patients with no lymph node metastasis (blue) compared with patients with pN1 or pN2 lymph node metastasis (gray) (two-tailed p = .046, log-rank test). BMTC, bone marrow-derived T cell; NSCLC, non-small-cell lung cancer; PBTC, peripheral blood-derived T cell; TA, tumor-associated antigen.
