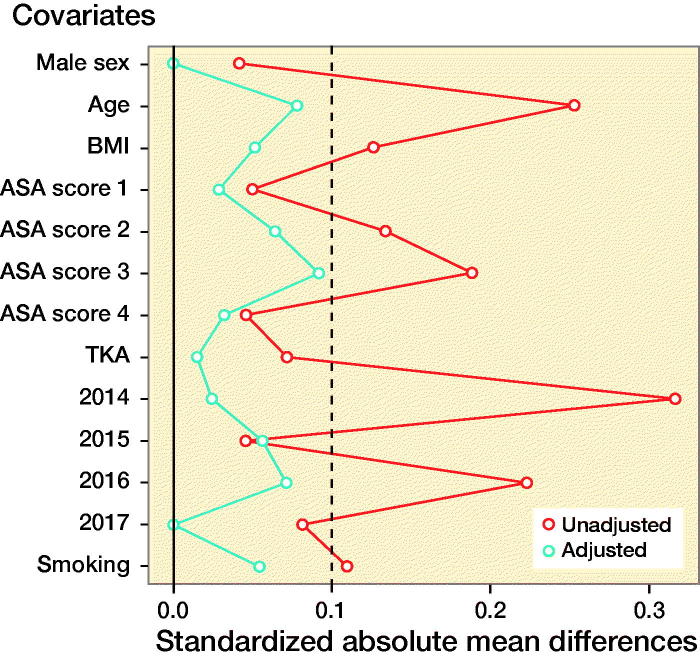
Covariate balance before (unadjusted) and after (adjusted) propensity score matching. Standardized differences less than 10% (dashed line) indicate an appropriate balance (Austin 2010).

An official website of the United States government
Here's how you know
Official websites use .gov
A
.gov website belongs to an official
government organization in the United States.
Secure .gov websites use HTTPS
A lock (
) or https:// means you've safely
connected to the .gov website. Share sensitive
information only on official, secure websites.
