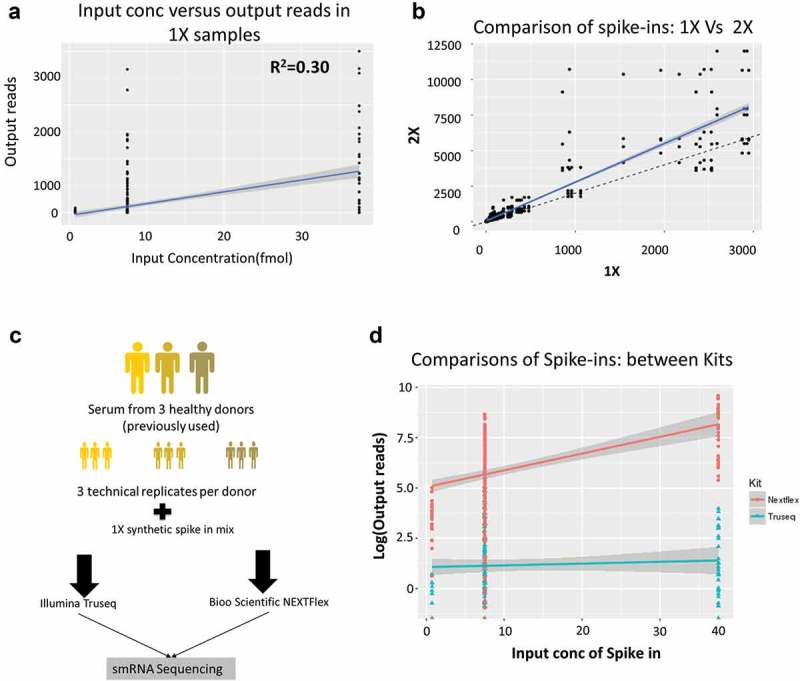
Figure 3.

Spike-in analysis reveals the presence of sequencing bias in Truseq protocol.
(a) Comparison of the spike-in input concentrations (known) versus the output from the 1X samples measured in terms of number of reads mapped in the Truseq protocol showing a correlation of 0.30 which implying the presence of a bias in the protocol. (b) Comparison of the samples spiked with 1x and 2X spike-ins shows the number of reads obtained per spike-in. The solid blue line is the line of best fit, while the dashed black line shows the expected line with a slope of 2. Several spike-ins do not align on either line indicating either over or underrepresentation in the output read counts. (c) The follow-up study comprised three donors (previously used) replicated three times each (technical replicates). All nine RNA samples were spiked 1X synthetic miRNA mix and sequenced using either a Truseq small RNA protocol or a Nextflex small RNA protocol to compare which kit reduced the bias observed. (d) Shown is the comparison of the spike-in input concentration versus output reads for the Illumina Truseq (blue) and Bioo Nextflex (red) small RNA kits.
