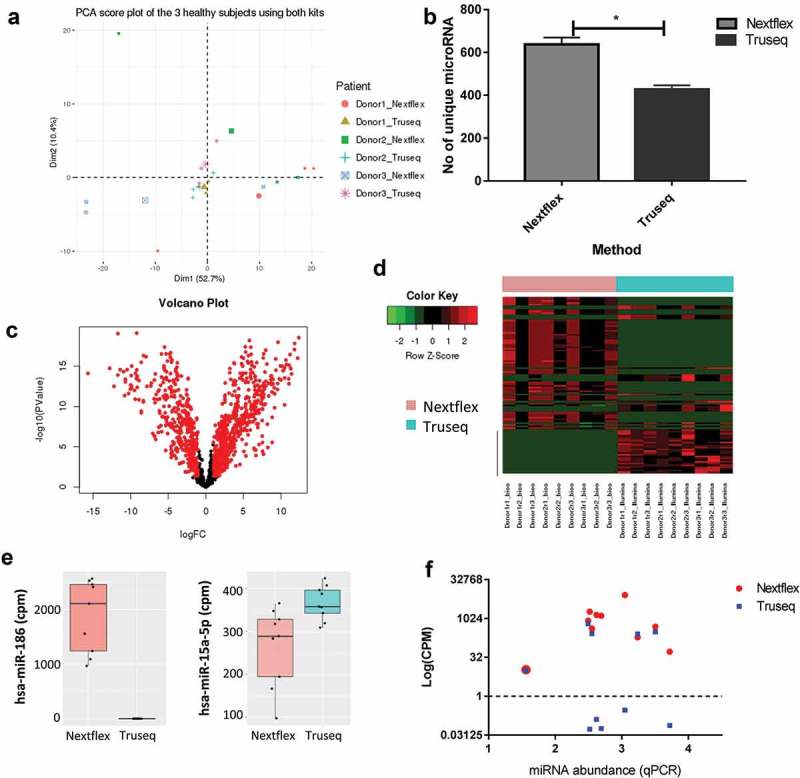
Figure 4.

Choice of library preparation impacts the sequencing results obtained by small RNA-Seq.
(a) Principal component analysis shows the biological and technical variability between samples after sequencing with the Truseq and Nextflex kits. The samples were batch corrected by ComBat to account for batch-specific differences and the image are coloured by donor and kit. (b) The number of unique miRNAs detected is higher in the Nextflex kit when compared to the Truseq Kit (p-value = 0.01). (c) Volcano plots of differential gene expression between the Truseq and Nextflex kits are shown. The plots illustrate the log10 Benjamini–Hochberg corrected p-value vs. the log2 change of transcript abundance. Red indicates miRNAs that differ between kits. (d) Heatmap of the top differential expressed genes using the Nextflex and Truseq kits is shown. The horizontal bar on top depicts the samples from each kit, the colour that represents the specific kit is provided in the legend on the left of the figure. (e) Representative box plots are shown of two differentially expressed miRNA that were detected by either the Nextflex or both the Nextflex and Truseq kits. The y-axis shows the counts per million reads of the two miRNAs as detected by library preparation kit (f) Scatter plot measuring miRNA expression by sequencing (measured in log counts per million, coloured by kit) versus quantitative PCR shows that only Nextflex detected all 10 of the genes detected by qPCR. The Pearson correlation for the Nextflex kit was 0.1 against qPCR while the correlation for Truseq versus qPCR was 0.05.
