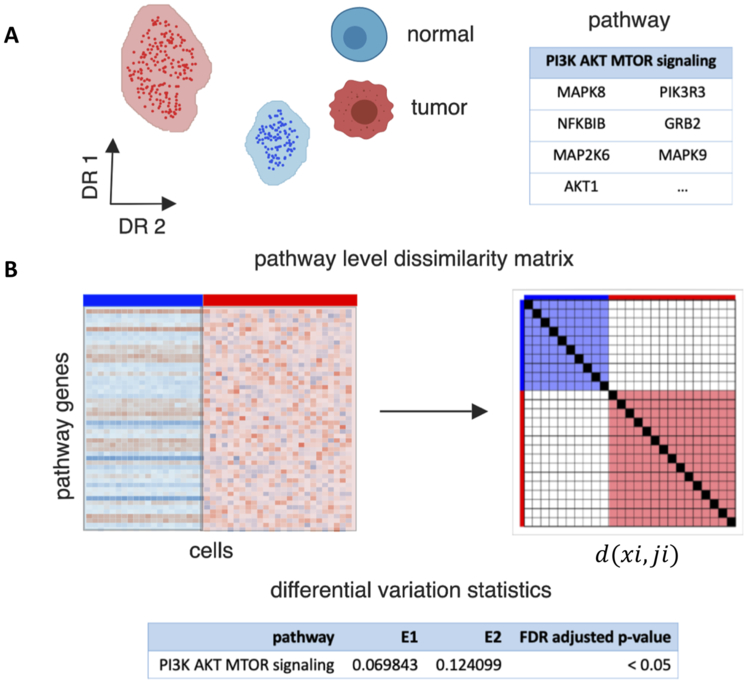
Figure 1. Overview of EVA algorithm to compare pathway-level transcriptional heterogeneity between groups of cells from two phenotypes.

A. EVA inputs a single-cell gene expression matrix for cells from two phenotypes, such as tumor and normal cells, and a list of genes annotated to a single pathway. B. EVA extracts the expression profiles for pathway specific genes. It then computes the dissimilarity between the expression profiles for each pair of cells from the same phenotype using a user specified dissimilarity metric. Finally, EVA computes the expected dissimilarity between pairs of cells of each phenotype and U-theory statistics are applied to test the null hypothesis that the expected dissimilarity between pairs of cells from one phenotype is equal to the expected dissimilarity between paris of cells in the other. The expected dissimilarity between pairs of cells from one phenotype is called the EVA statistic, which quantifies the inter-cellular heterogeneity for a given pathway. The U-theory statistics provide a robust estimate to quantify p-values that compare this relative heterogeneity between phenotypes.
