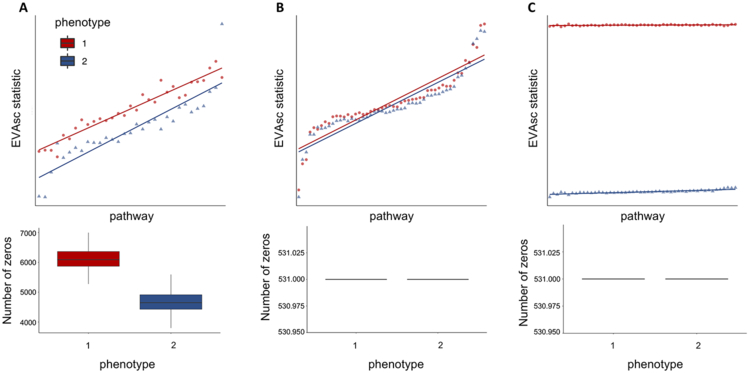
Figure 2. Performance of EVA with Kendall-tau dissimilarity on simulated data.

A. We apply EVA to a simulated dataset containing 50 pathways with no differential variation between cells from two phenotypes, but differential bias in their respective dropout rates. EVA statistics using a Kendall-tau dissimilarity have differential heterogeneity consistent with the simulated dropout rates. B. After MAGIC imputation of the data from A, EVA finds no significant differentially variable pathways and EVA statistics overlap for the two groups. C. We generate an additional simulated dataset by adding randomized signal to one group from the imputed data. The EVA statistics for significant pathways reflects the true heterogeneity in the simulated dataset.
