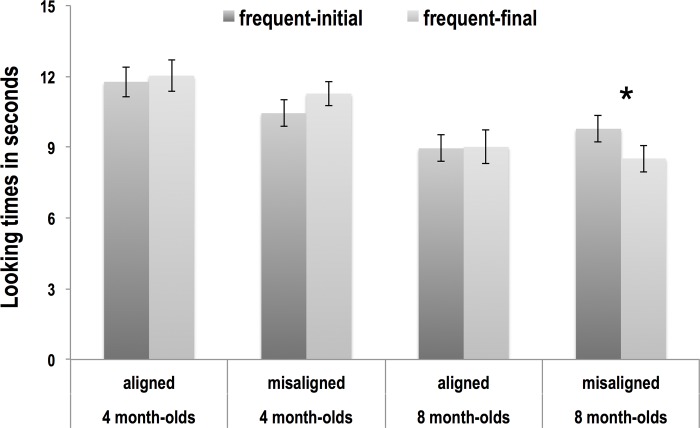
Fig 4. Looking time results.
The x axis shows the four groups examined. The y axis displays the infants’ looking times in seconds. The dark grey bars depict looking times to the frequent-initial items, and the light grey bars looking times to the frequent-final items. Error bars represent the standard error of the mean.

