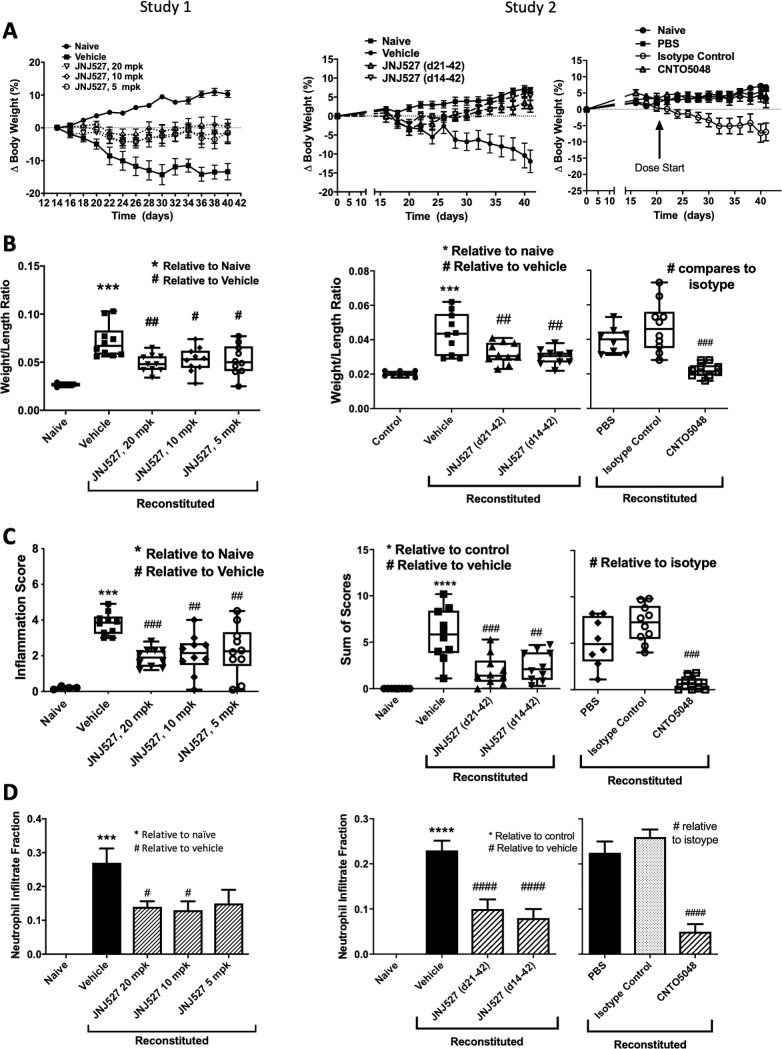
Fig 3. Clinical and histopathology scores for healthy control mice and in T cell reconstituted colitic mice in studies comparing JNJ-40346527 to vehicle.
CNTO5048 (anti-TNFα) served as a positive control. (A) Change in body weight; (B) colon weight/length (W/L) ratio; (C) Sum of histological scores; (D) Estimated fraction of cellular infiltrate that were neutrophils. Naïve control group, n = 4 (Study #1) or n = 8 (Study #2). PBS group, n = 8. All remaining groups, n = 10. Data are mean ± SEM (A and D) or five quartile box plots, 95% confidence interval (B and C). *#P<0.05 relative to naïve or vehicle control, respectively. #, p<0.05; ##, p<0.01; *** or ###, p<0.001; **** or ####, p<0.0001.

