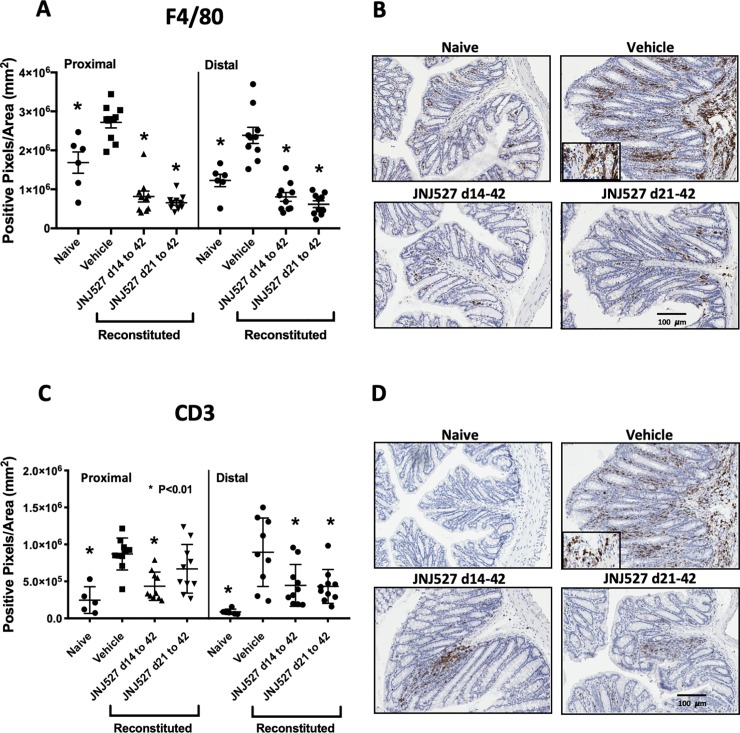
Fig 4.
Colonic mucosa from T cell reconstituted colitic mice stained for F4/80 (A) and (B), and CD3 (C) and (D) antigens. Data points are positive pixels per mm2 determined by digital imaging of three sections per mouse per colonic region. Data are group mean ± SEM shown together with values from each mouse. Naïve control group, n = 6. All remaining groups, n = 10. *P<0.01 relative to respective vehicle control for either proximal or distal colon. Images are representative of sections with median pixel density. Insets represent enlarged images of cellular infiltrates to demonstrate cellular morphology.

