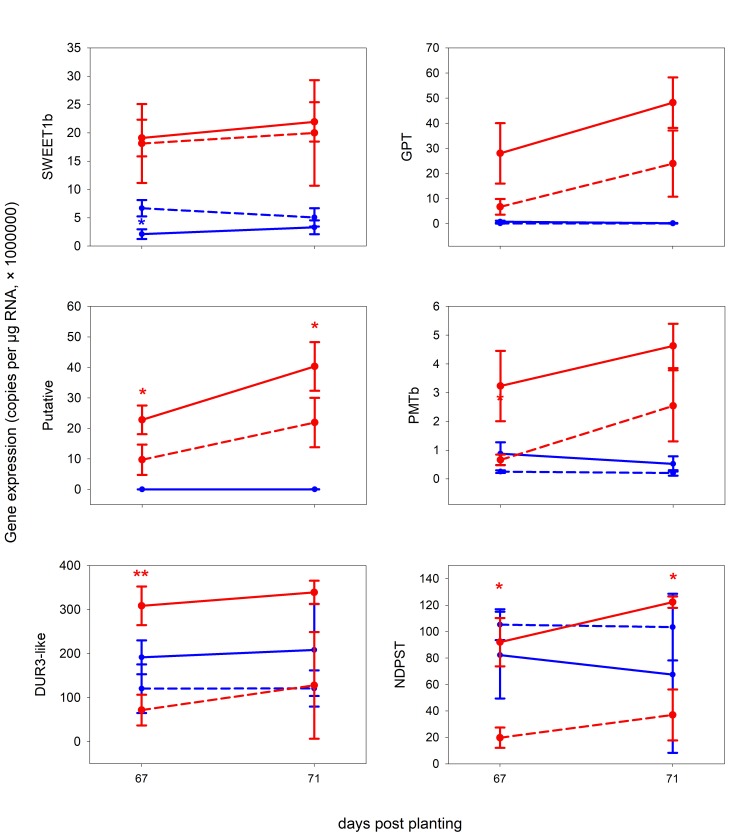
Fig 3. The expression of several genes obtained by qPCR from roots of M. truncatula in Exp 2.
X-axis: days post planting, Y-axis: number of corresponding-gene copies per 1 μg of RNA subjected to reverse transcription. Red: mycorrhizal, Blue: non-mycorrhizal, Full line: full light (100%), dashed-line: shaded plants (10% of light). Error bars show standard deviations, n = 3. For further details see Materials and methods and S2 Table. Asterisks indicate significance levels (p-value classes) as per t-test comparing non-shaded and shaded plants within the mycorrhizal (red) or non-mycorrhizal (blue) treatments: 0 < *** < 0.001 ≤ ** < 0.01 ≤ * < 0.05.

