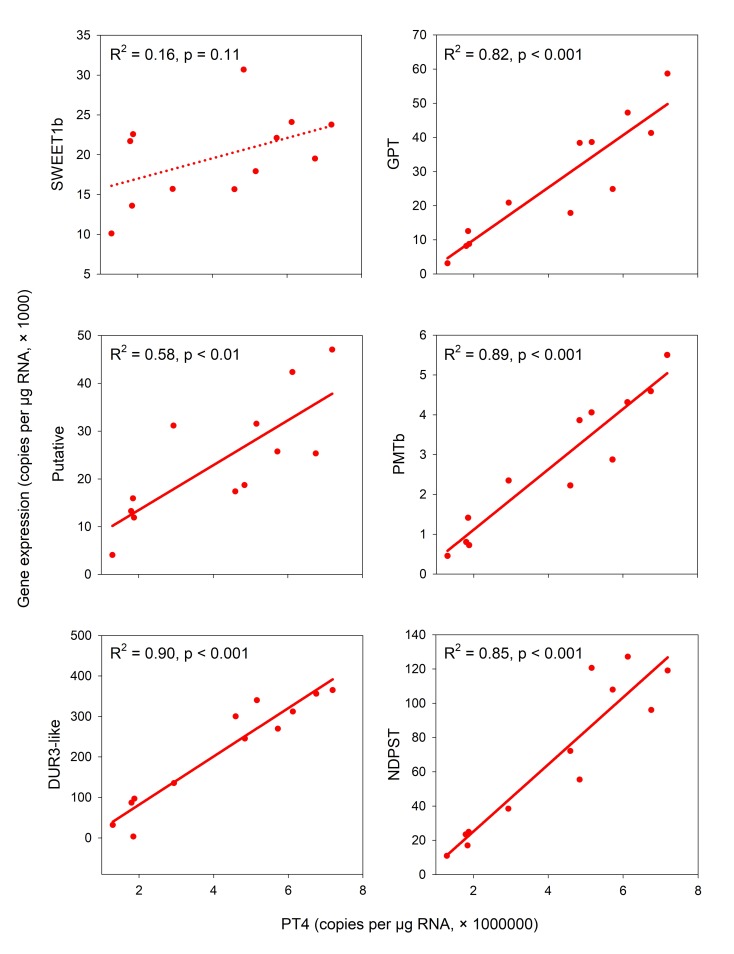
Fig 4. Scatterplots with simple linear regression of expressions of several genes against PT4 expression in the mycorrhizal root samples in Exp 2.
X-axis: number of PT4 copies per 1 μg of RNA subjected to reverse transcription, Y-axis: number of corresponding-genes copies per 1 μg of RNA subjected to reverse transcription. Both harvests (67 and 71 dpp) and both light treatments (100% and 10% light) are included in the analysis. R2 and p-values for each specific regression are provided next to the regression lines.

