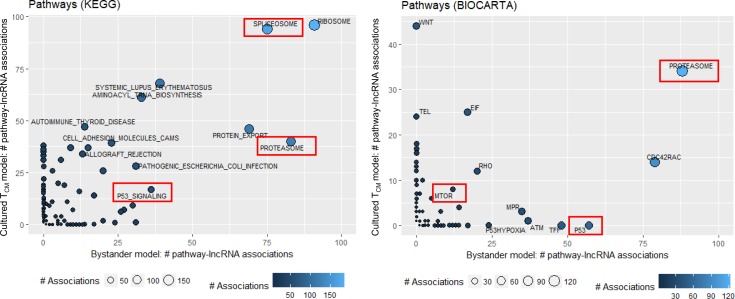
Fig 4. Pathways associated with lncRNA dysregulated in latency, identified by the guilt-by-association (GBA) analysis.
Expression of lncRNAs dysregulated in latency (EdgeR’s FDR corrected p-value<0.05) was correlated with expression of all detected mRNAs. A ranked mRNA gene list was constructed for each lncRNA based on their correlation coefficients and used as input for gene set enrichment analysis (GSEA) with KEGG and Biocarta pathway databases. A lncRNA was considered significantly associated to a pathway when the GSEA FDR corrected p-value was less than 0.05. Number of lncRNA pathway associations is shown on the X-axis for the bystander model and Y-axis for cultured TCM model, color-coded with blue shades and indicated by the size of the circle (lighter blue color and larger circle size correspond to the greater number of associations). Ribosome and spliceosome pathways have the most associations with dysregulated lncRNAs in both models. Pathways that line up along the X axis were identified for the bystander model dataset only; while pathways that line up along the Y axis were identified for the cultured TCM model only. Pathways relevant to HIV latency are highlighted by red boxes.

