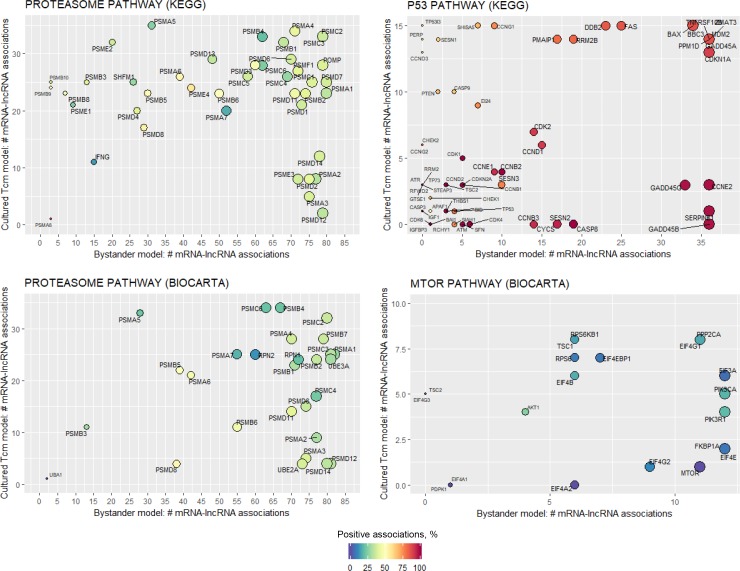
Fig 5. Associations between dysregulated lncRNAs and the mRNA components of pathways implicated in HIV latency.
For each lncRNA that was significantly associated with a pathway of interest (red boxes in Fig 4), leading edge mRNA genes were identified that drive the pathway enrichment score (GSEA). Next, the number of lncRNAs associated to pathway-specific mRNAs were plotted (ggplot2 v2.2.1). Number of associations between mRNA and lncRNA is shown on the X-axis for the bystander model and Y-axis for cultured TCM model, and indicated by the size of the circle (larger circle size corresponds to the greater number of associations). Color shows the percentage of positively correlated mRNA/lncRNA pairs (dark red is 100% positive correlations; dark blue–no positive correlations; yellow–equal number of positive and negative correlations).

