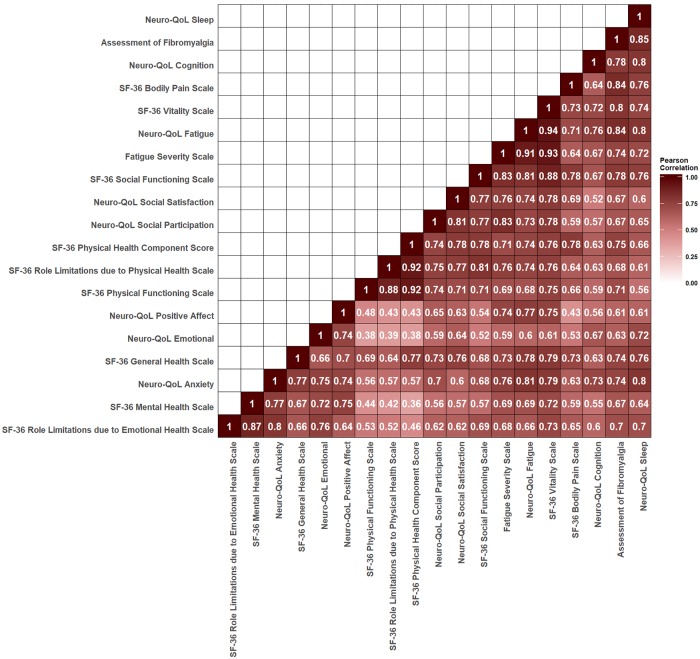
Fig 2. Correlation Analysis Between Symptom Scales.
Scores were analyzed for pairwise covariation by the Pearson correlation analysis. All correlation coefficients with P < 0.05 except for the correlation between the Short Form-36 version 2 (SF-36) Physical Health Component score and the SF-36 Mental Health subscale, which had a P = 0.053.

