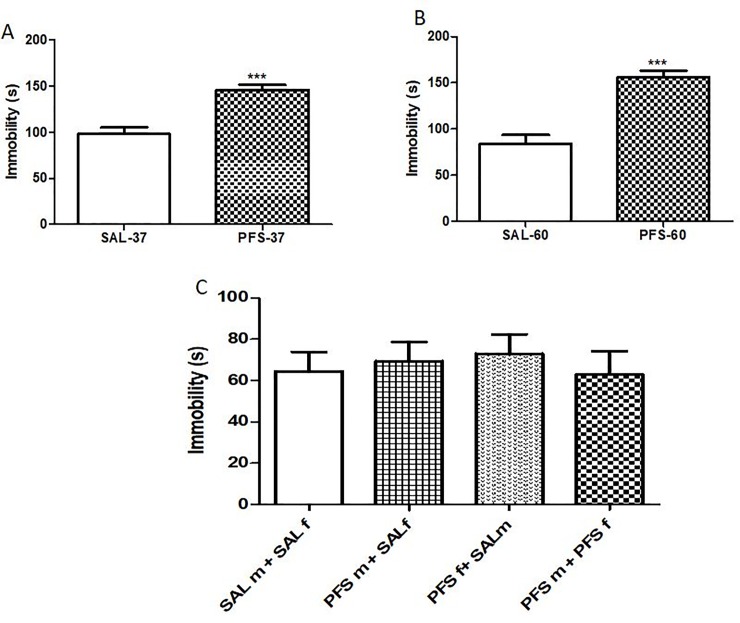
Fig 3. Effects of PFS on the amount of time rats exhibited immobility during the forced swim test.
Fig 3A represents F0 generation on PND 37***(SAL vs. PFS, p<0.0001). Results expressed as mean ± SEM (n = 10/group). Fig 3B: F0 rats on PND 60 ***(SAL vs. PFS, p<0.0001). Results expressed as mean ± SEM (n = 10/group). Fig 3C showed the effect of PFS on F1 generation. On PND 37 no significant PFS effect across groups in the F1 generation of rats [F (3, 24) = 0.2206, p = 0.8811]. Results expressed as mean ± SEM (n = 7/group).

