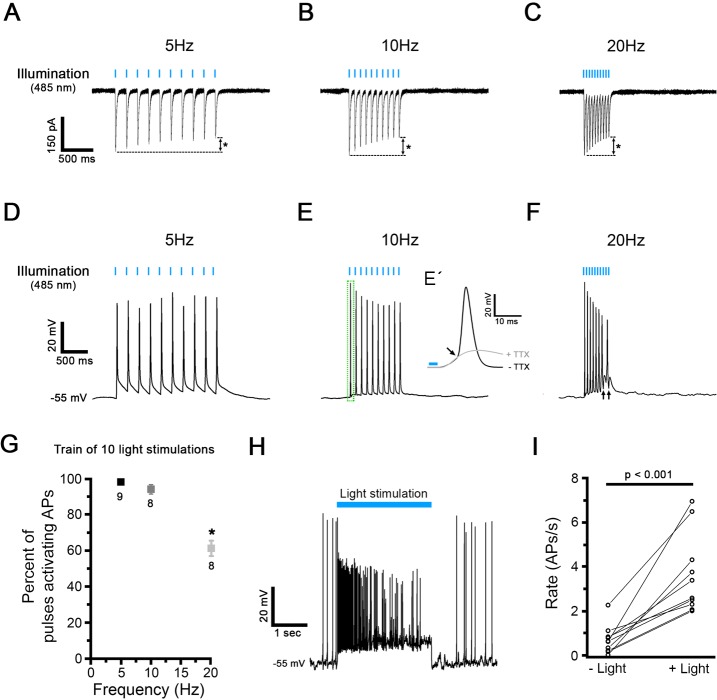
Fig 15. Electrophysiological recordings and optogenetic light stimulation of hChR2-hNP-derived neurons differentiated in vitro.
(A-C) Representative voltage clamp traces in response to blue light stimulation (485 nm) at 5 Hz (A), 10 Hz (B) and 20 Hz (C) obtained in hChR2-hNP-derived neurons. The amplitude of the 1st pulse response was similar at each tested stimulation rate (for example, 269.8 ± 42.2 pA at 5 Hz). However, response amplitudes decreased during the 10-pulse stimulation, by a total of 29–36% (from 1st to 10th pulse), with an increasing level of adaptation at higher stimulation rates (asterisks). (D-F) Representative current clamp traces in response to a train of light stimulation at 5 Hz (D), 10 Hz (E) and 20 Hz (F). Before light exposure, the membrane potential was preset to -55 mV by current injection. When TTX is added to the extracellular solution AP generation is blocked (E´). (G) Comparison of spiking fidelity in response to different rates of 10-pulse optogenetic stimulations. (H) During a single 2.5s-long light stimulation, the AP firing rate initially increases and then adapts. (I) During a 2.5 s-long single light stimulation (+light), AP firing rate significantly increased from 0.7 ± 0.2/s (-light) to 3.6 ± 0.6/s (n = 10; p < 0.001, paired t-test).

