Figure 3.

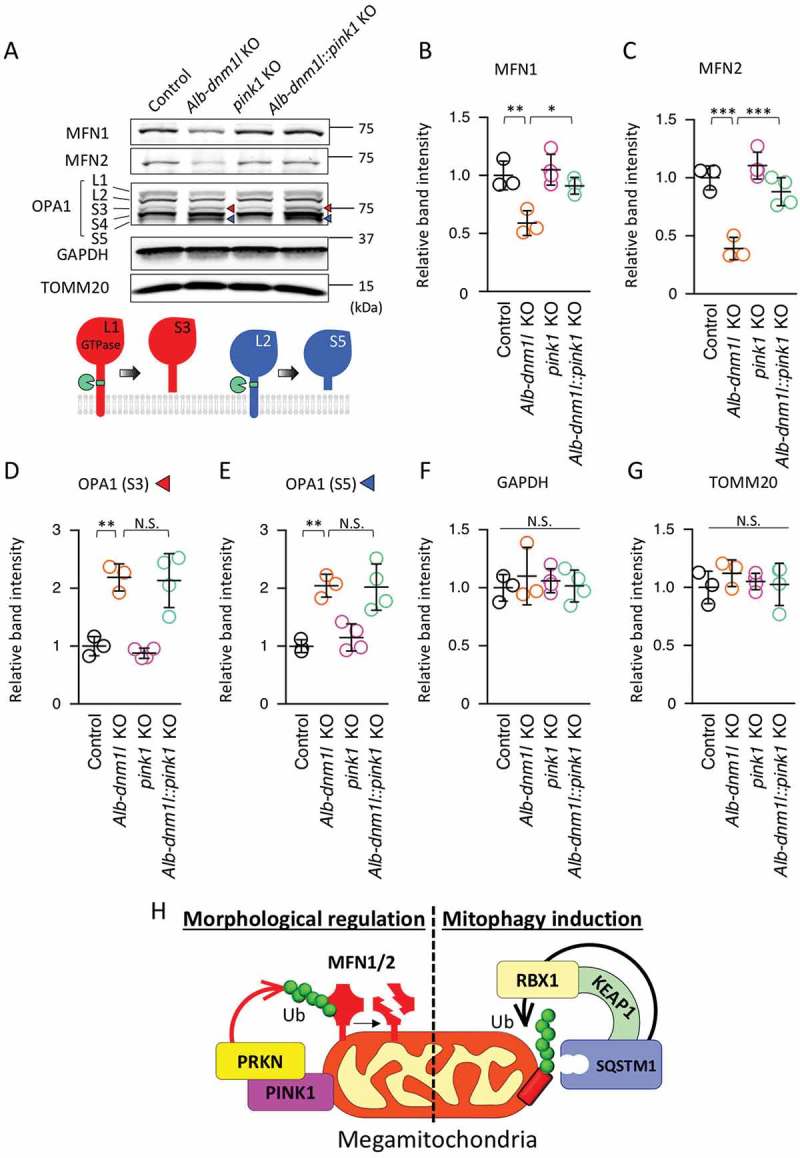
Additional loss of PINK1 restores the amounts of MFN1 and 2 that are decreased in Alb-dnm1l KO hepatocytes. (A) Immunoblotting of livers isolated from the indicated mice at 3 months using antibodies against MFN1 and 2, OPA1, GAPDH, and TOMM20. Lower image represents a model for OPA1 processing. (B–G) Quantification of band intensity of MFN1 (B), MFN 2 (C), OPA1-S3 (D), OPA1-S5 (E), GAPDH (F), and TOMM20 (G). Values are average ± SD (n = 3–4). (H) Model for mitochondrial ubiquitination mediated by the SQSTM1-KEAP1-RBX1 complex in mitophagy and by the PINK1-PRKN pathway in morphological regulation. Statistical analysis was performed using ANOVA followed by the post-hoc Tukey test: *p < 0.05, **p < 0.01.
