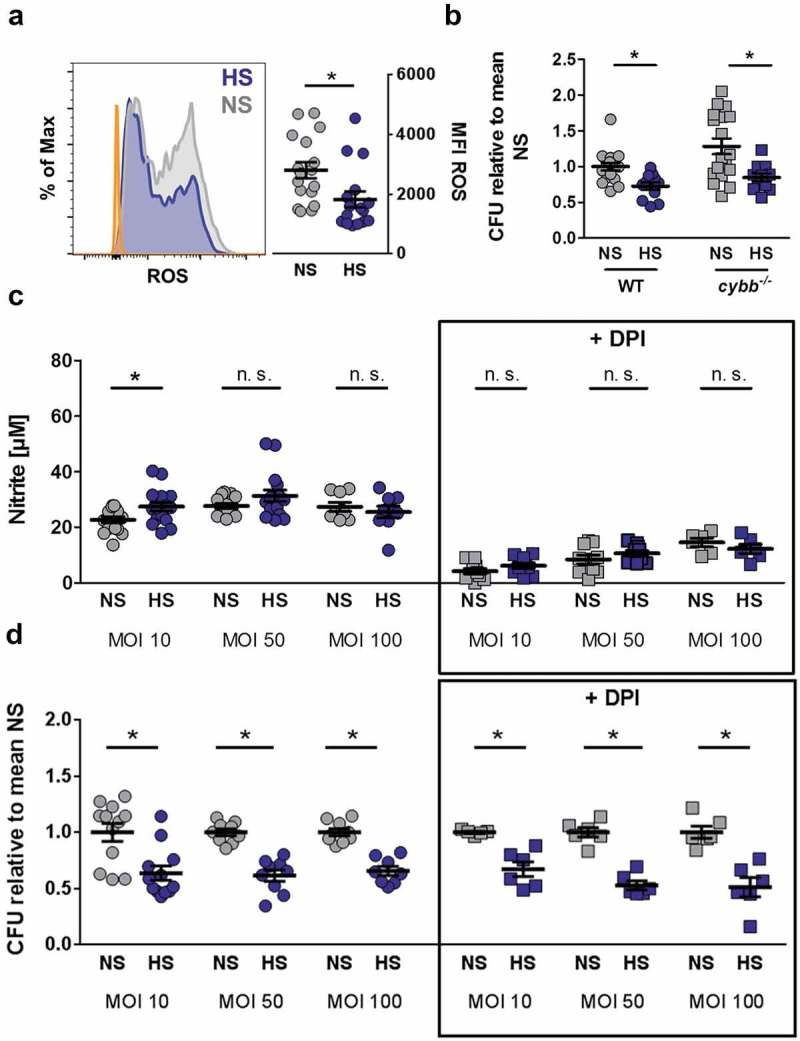
Figure 3.

HS-boosted antibacterial activity of MΦ is independent of PHOX and NOS2. (a) As in Figure 1(f), but 6 h after infection, BMDM were stained with CM-H2DCFDA and subjected to flow cytometry. Left section, histogram. Orange area, unstained cells; Gray area, NS; Blue area, HS. Right section, means ± s.e.m; n = 16 −17; Mann Whitney test; * p < 0.05 (b) As Figure 1(f), but cybb-/- and littermate control (WT) BMDM were used. Intracellular E. coli in CFU relative to mean CFU under NS WT conditions (means ± s.e.m; n = 11–18; Student’s t test ± Welch correction; * p < 0.05) (c) BMDM were infected with E. coli at the indicated MOI, subjected to gentamicin protection assays and exposed to NS and HS conditions 2 h after infection ± DPI where indicated. 24 h after infection, nitrite levels were quantified (means ± s.e.m; n = 6–16; Student’s t test and Mann Whitney test; * p < 0.05). (d) As in (c), intracellular E. coli load 24 h after infection in CFU relative to mean CFU under the respective NS conditions (means ± s.e.m; n = 5–12; Student’s t test ± Welch correction; * p < 0.05).
