Figure 4.

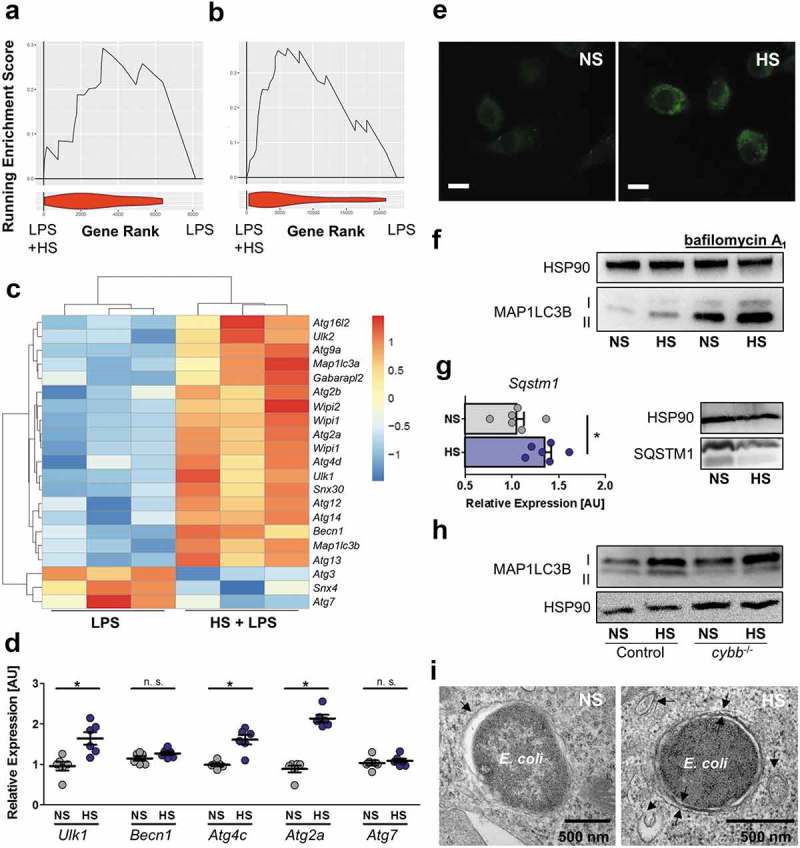
HS increases autophagy in E. coli-infected MΦ. (a and b) GSEA for the HUGO autophagy gene set. Upper section, genes are placed in rank order based on differences in expression on the x-axis and the curve represents the running enrichment score across the dataset. Bottom section, violin plot indicating the frequency distribution of the genes within the HUGO gene set by rank. (a) GSEA using the dataset of Ip et al. [2] (b) GSEA of own Agilent microarray data of RAW264.7 MΦ stimulated with LPS ± 40 mM NaCl for 24 h. (c) Heatmap of gene expression from own Agilent array. Genes plotted are genes within the HUGO autophagy gene set and significantly differentially expressed (Benjamini Hochberg adjusted p value < 0.05) for the addition of Na+ to LPS (10 ng/mL) treated MΦ. (d) As in Figure 1(f), but Ulk1, Becn1, Atg2a, Atg4c and Atg7 mRNA levels were quantified (means ± s.e.m; n = 6; Student’s t test ± Welch correction; * p < 0.05). (e) As Figure 1(f), but GFP-MAP1LC3 expressing BMDM were used. GFP-MAP1LC3 puncta formation was assessed. Representative images of three experiments are displayed. Scale bar: 10 µm. (f) RAW264.7 MΦ were treated as in (d), but for ½ h ± pretreatment with 100 nM bafilomycin A1. A representative immunoblot of MAP1LC3B and HSP90 levels is displayed. (g) As in (d), Sqstm1 was determined on mRNA (means + s.e.m; n = 6; Student’s t test; * p < 0.05) and protein level. (h) As (f), but Cybb-/- and controls BMDM were used. (i) As in (d), but cells were subjected to transmission electron microscopy. Representative E. coli-containing vacuoles of two experiments are displayed.
