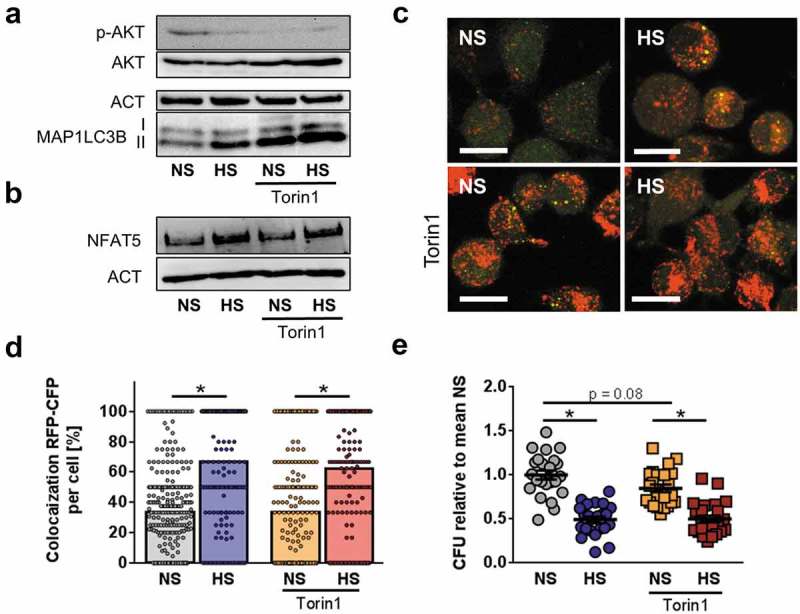
Figure 8.

Blunted AKT and MTOR activation does not account for HS-augmented antibacterial activity. (a) As in Figure 1(f), RAW264.7 MΦ were pretreated ± 1 µM Torin1 and infected ± HS. Cells were harvested ½ h post infection. Immunoblots of p-AKT, AKT, MAP1LC3B and ACT levels are displayed. (b) As in (a), but 2 h post infection, NFAT5 and ACT levels were assessed. (c) As in (b), but RFP-GFP-mLC3 RAW264.7 MΦ were used. A representative confocal image out of two experiments is shown. Scale bar = 10 µm. (d) As in (c), but sCFP3A-E. coli were used. Rate of E. coli-sCFP3A/RFP-colocalization per cell. At least 184 MΦ from two independent experiments (bars: median scores; Mann Whitney test; * p < 0.05). (e) As in (b), but intracellular E. coli load is displayed 2 h after infection in CFU relative to mean CFU under NS conditions (means ± s.e.m; n = 23–24; ANOVA with Bonferroni’s test; * p < 0.05).
