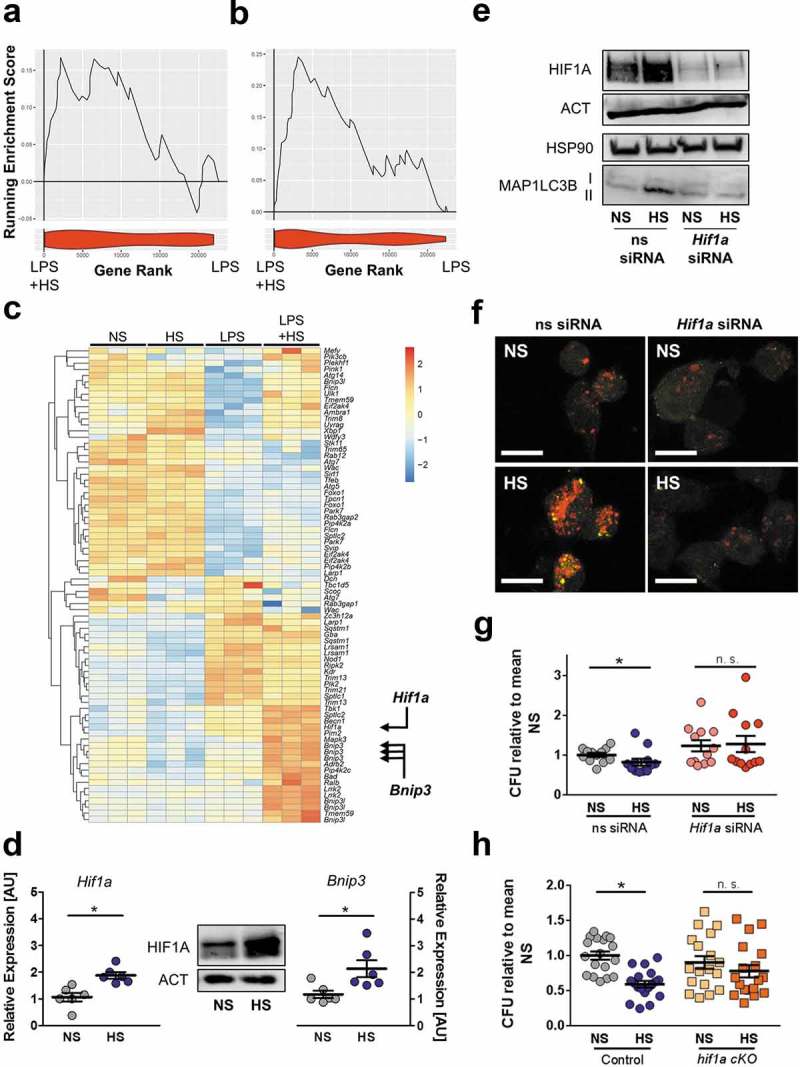
Figure 9.

The presence of HIF1A is required for HS-triggered autophagy induction and antibacterial activity. (a and b) GSEA for negative (a) and positive (b) regulators of autophagy. Upper section, genes are placed in rank order based on differential expression between the groups on the x-axis and the curve represents the running enrichment score across the dataset. Bottom section, violin plot indicating the frequency distribution of the genes within the respective GO of positive enrichment of autophagy regulators by rank. (c) Heatmap of gene expression from own Agilent array. Genes plotted are genes within the HUGO autophagy regulatory gene set, which are upregulated and significantly differentially expressed (Benjamini Hochberg adjusted p value < 0.05) with the addition of NaCl to LPS-treated MΦ. (d) Left and right section, as in Figure 1(f), but Hif1a and Bnip3 mRNA levels were quantified (means ± s.e.m; n = 6; Student’s t test or Mann Whitney test; * p < 0.05). Middle section, HIF1A and ACT protein levels. (e to g) As in Figure 1(f), but ns siRNA- and Hif1a-specific siRNA (Hif1a siRNA)-treated RAW264.7 MΦ were used. (e) Upper section: HIF1A and ACT protein levels 4 h after infection. Lower section: MAP1LC3B and HSP90 as Figure 4(f). (f) Instead of RAW264.7 MΦ, RFP-GFP-mLC3 RAW264.7 MΦ were used. Confocal images: GFP, green; RFP, red. Scale bar = 10 µm. Representative images out of two experiments are shown. (g) As in Figure 1(f), intracellular E. coli load, CFU relative to mean CFU under ns siRNA-treated NS conditions (means ± s.e.m; n = 12; Mann Whitney test; * p < 0.05) (h) As in Figure 1(f), but BMDM from hif1a cKO and littermate controls were used. Intracellular E. coli load in CFU relative to mean CFU under NS conditions is displayed (means ± s.e.m; n = 18; Student’s t test or Mann Whitney test; * p < 0.05).
