
Figure 3.
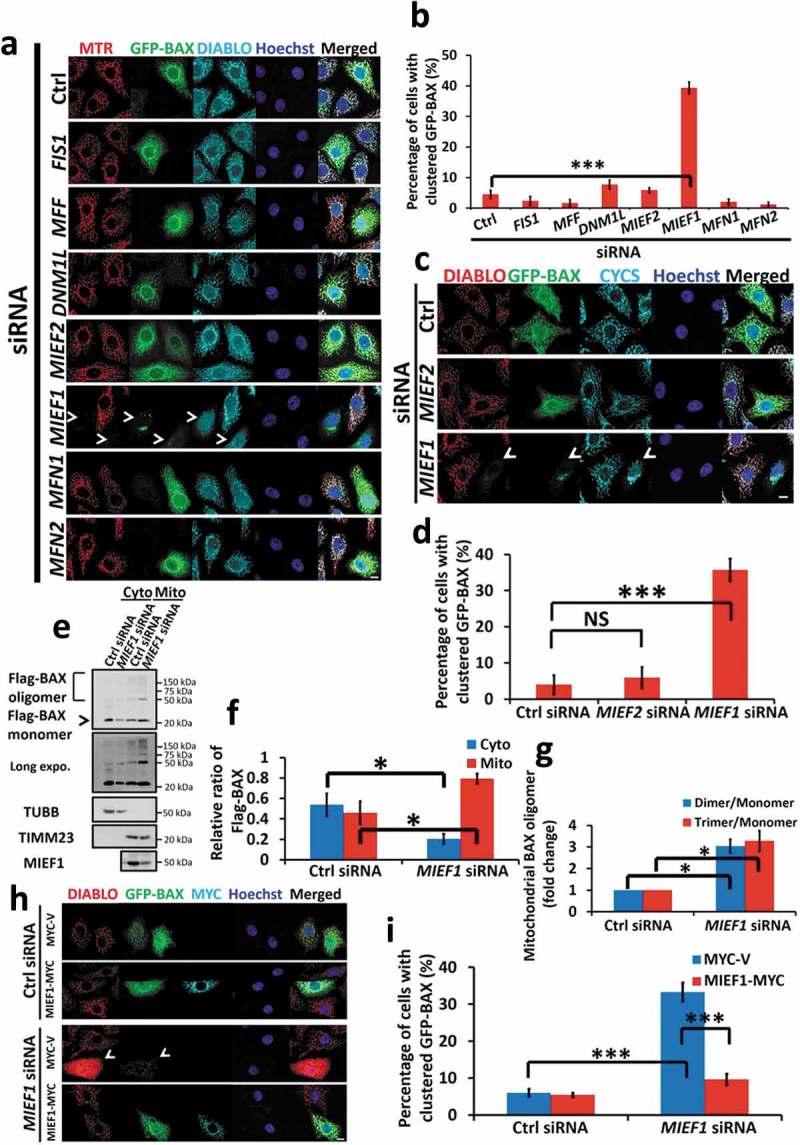
MIEF1 regulates BAX. (a) HeLa cells were transfected with the indicated siRNA for 24 h. Cells were then transfected with GFP-tagged BAX (green) for further 24 h. Cells were incubated with MitoTracker Red (MTR, red) for 15 min and hereafter fixed and immunostained for DIABLO (cyan). Hoechst, blue. Scale bar: 10 µm. Arrowheads indicate cells with BAX translocation. (b) Quantification of GFP-BAX translocation onto mitochondria as shown in (a). Bars represent the mean ± SD. ***P < 0.001. n > 150 cells for each group from 3 independent experiments. (c) HeLa cells were transfected with the indicated siRNA for 24 h and GFP-tagged BAX (green) for further 24 h, then fixed and immunostained for DIABLO (red) and CYCS (cyan). Hoechst, blue. Scale bar: 10 µm. Arrowheads indicate cells with BAX translocation. (d) Quantification of GFP-BAX translocation onto mitochondria as in (c). Bars represent the mean ± SD. ***P < 0.001, NS, not significant. n > 150 cells for each group from 3 independent experiments. (e) Cells were treated with control or MIEF1 siRNA for 48 h before transfection with Flag-tagged BAX for further 24 h. The oligomerization of Flag-BAX in mitochondrial fraction was determined via crosslinking using 2 mM BMH. (f) Quantification of Flag-BAX monomer as shown in (e). Flag-BAX monomer was normalized to TUBB (cytosol) or TIMM23 (mitochondria). Cytosolic or mitochondrial Flag-BAX monomer was expressed as a percentage of total Flag-BAX monomer. Data are means ± SD (n = 3). *P < 0.05. (g) The ratio of BAX dimer or trimer to monomer in mitochondrial fraction was quantified from 3 independent experiments as in (e). Bars indicate means ± SD. *P < 0.05. (h) HeLa cells were transfected with control or MIEF1 siRNA for 24 h before transfection with MYC-tagged vector or Mief1 (Mus musculus) plus GFP-tagged BAX (green) for further 24 h, then fixed and immunostained for DIABLO (red) and MYC (cyan). Hoechst, blue. Scale bar: 10 µm. Arrowheads indicate cells with BAX translocation. (i) Scoring of the GFP-BAX translocation onto mitochondria as in (h). Error bars represent SD. ***P < 0.001. n > 150 cells for each group from 3 independent experiments.