
Figure 5.
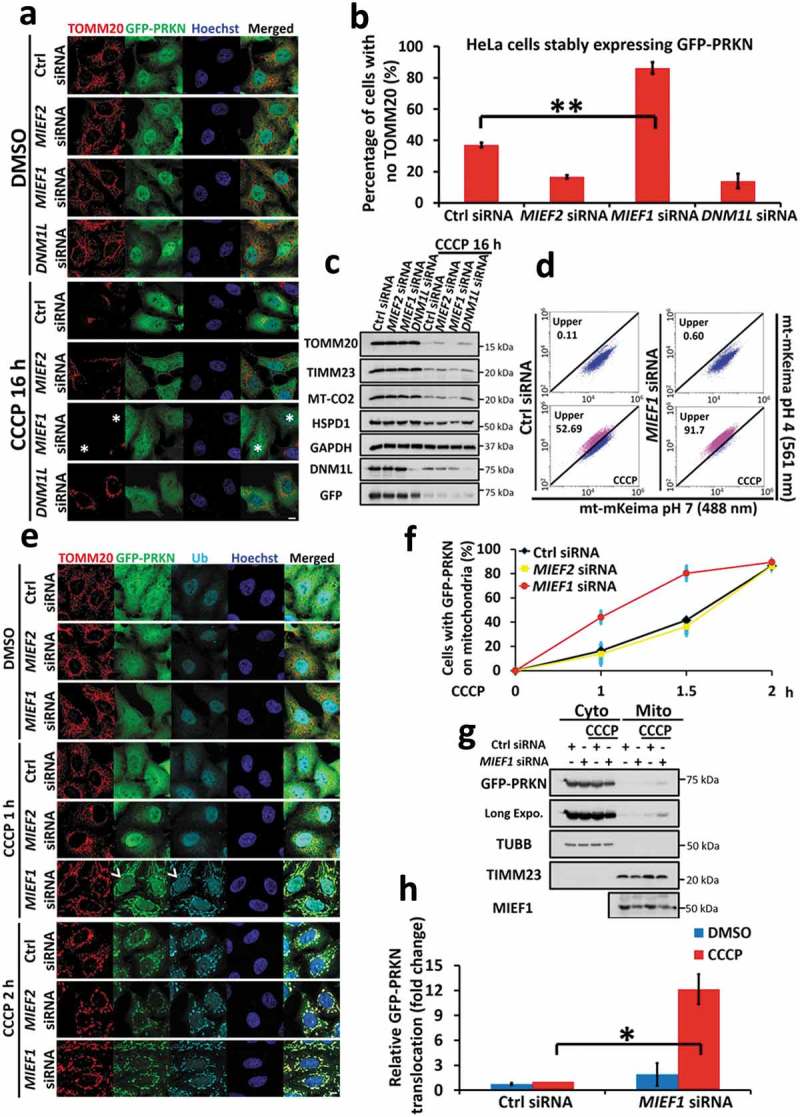
MIEF1 loss primes cells to PINK1-PRKN-dependent mitophagy. (a) HeLa cells stably expressing GFP-PRKN (green) were transfected with the indicated siRNA for 48 h. Cells were then treated with DMSO or 10 µM CCCP for 16 h, followed by immunostaining with anti-TOMM20 antibody (red). Hoechst, blue. Scale bar: 10 µm. Asterisks indicate mitophagic cells. (b) PRKN-mediated mitophagy shown as in (a) was quantified. Data represent mean ± SD. **P < 0.01. n > 150 cells for each group from 3 independent experiments. (c) Total cell lysates treated as in (a) were subjected to SDS-PAGE and immunoblotting. (d) HeLa cells stably expressing YFP-PRKN and mt-mKeima were transfected with control or MIEF1 siRNA for 48 h. Cells were then treated with DMSO or 10 µM CCCP for further 16 h, followed by flow cytometry analysis. (e) HeLa cells stably expressing GFP-PRKN (green) transfected with the indicated siRNA for 48 h were treated with DMSO or 5 µM CCCP for the indicated time. Cells were then fixed and immunostained for TOMM20 (red) and Ubiquitin (cyan). Hoechst, blue. Scale bar, 10 µm. Arrowheads indicate PRKN translocation. (f) Quantification of PRKN recruitment onto mitochondria as in (e). Data points represent mean ± SD. n > 150 cells for each group from 3 independent experiments. (g) Immunoblotting analysis of cytosolic or mitochondrial fractions as in (e) treated with 5 µM CCCP for 0 h or 1.5 h, respectively. (h) Quantitative analysis of (g). GFP-PRKN was normalized to TUBB (cytosol) or TIMM23 (mitochondria). Data are presented as percentage of total GFP-PRKN, normalized to mitochondrial fraction of control siRNA group upon CCCP treatment. Error bar indicates SD from 3 independent replicates. *P < 0.05.