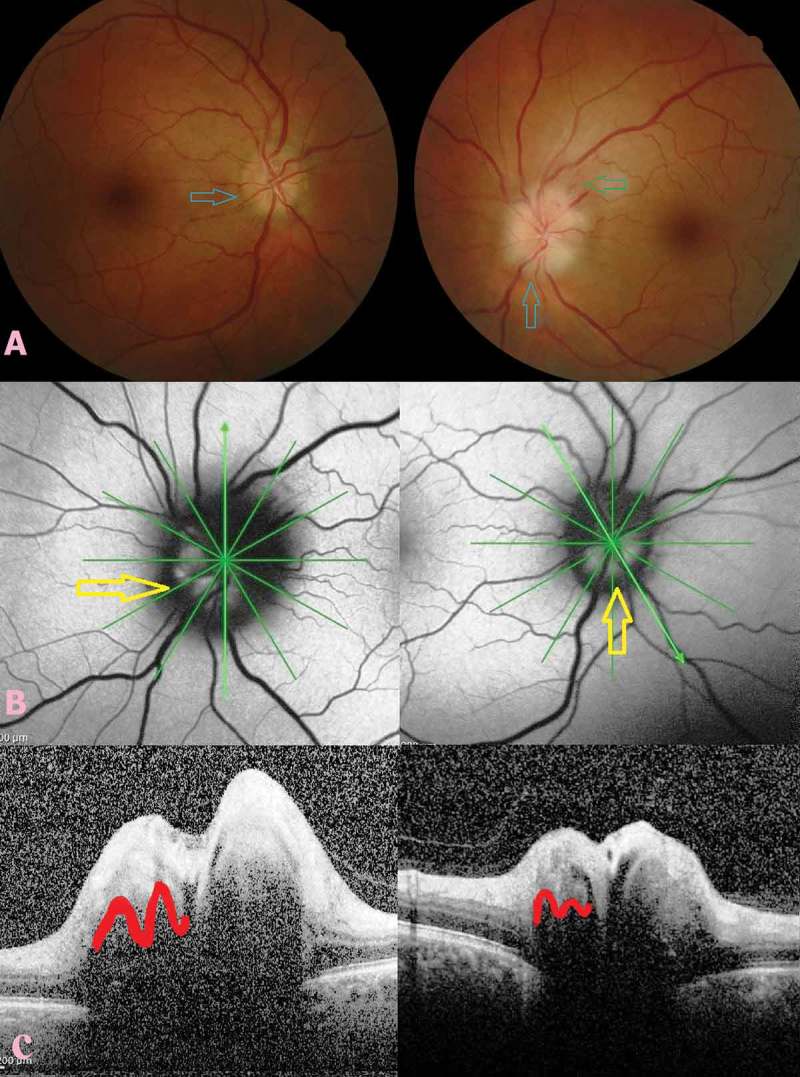
Figure 1.

Fundus picture, fundus autofluorescence (FAF) image and spectral-domain optical coherence tomography (SD-OCT) findings of optic nerve head drusen (ONHD). Fundus picture showing bilateral blurred optic disc margins with left disc oedema with splinter hemorrhages in adjacent nerve fibre layer (green arrow) and ONHD appearance in the nasal side of the right disc and inferior side of the left disc (blue arrows) (A). FAF image showing “hyperautofluorescence” appearance in the nasal side of the right disc and inferior side of the left disc (yellow arrows) (B). SD-OCT image showing a “lumpy-bumpy” internal contour appearance at the optic disc in both eyes (red contours) (C).
