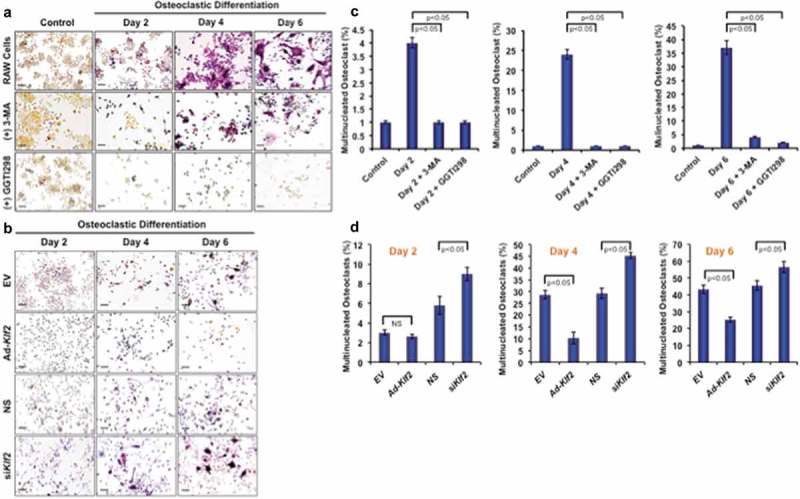
Figure 3.

Induction of KLF2 and reduction of autophagy inhibited osteoclastic differentiation. (a) TRAP staining was performed to determine differentiated osteoclasts from RAW264.7 cells in presence or absence of 3-MA (an autophagy inhibitor), or GGTI298 (a KLF2 inducer) during the course of osteoclastic differentiation. Undifferentiated cells were used as a control. (b) TRAP+ cells were visualized in Klf2 overexpressed (Ad-Klf2/EV) or Klf2 knockdown (NS or siKlf2) RAW264.7 cells during the course of osteoclast differentiation.(c) Bar graphs showing the cumulative data in percentage of TRAP+ cells present per high power field of image. Each experiment was performed at lest 3 times and 15 fields were counted/experiments. (d) Bar graphs represent the quantification of TRAP+ cells in Klf2 over-expressed (Ad-Klf2/EV) or Klf2 knockdown (siKlf2/NS) RAW264.7 cells during the course of differentiation. Each experiment was performed at least 3 times and 15 fields were counted/experiment. Data represent the Mean±SEM.
