Figure 5.

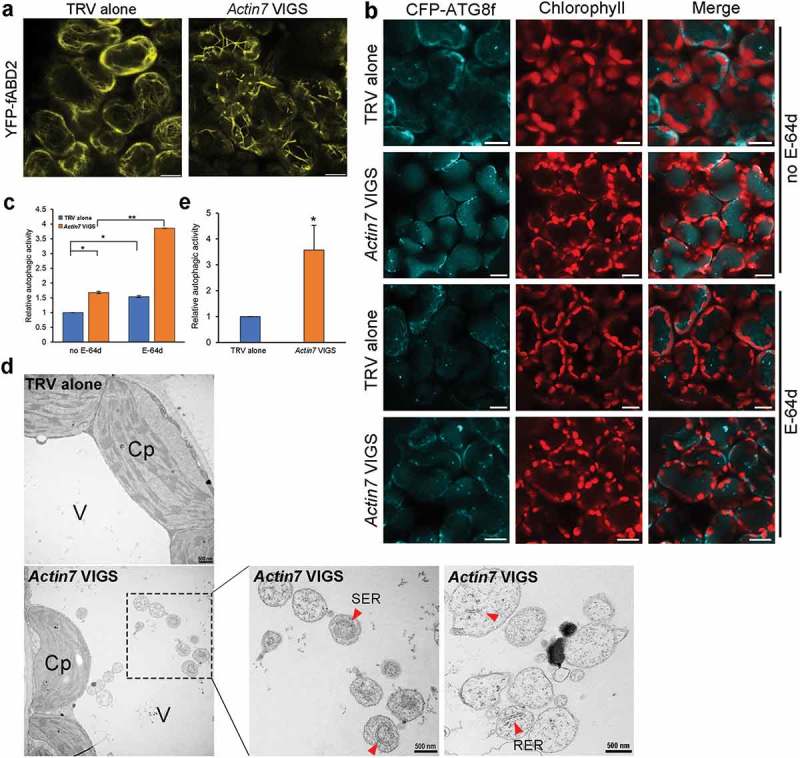
Autophagy is enhanced in Actin7-silenced plants. (a) Silencing of Actin7 (Actin7 VIGS) severely disrupted actin filaments. YFP-fABD2 is in yellow and chloroplasts are in red. Scale bars: 10 μm. (b) Representative confocal images of autophagic structures indicated by CFP-ATG8f in Actin7-silenced plants (Actin7 VIGS) and control plants (TRV alone) with (lower panel) or without (upper panel) E-64d. Confocal images were taken at the end of the day (dark 8 h). Autophagic structures were labeled by CFP-ATG8f. 100 μM E-64d was pre-infiltrated into leaves for 12 h before imaging. Scale bars: 10 μm. (c) Relative autophagic activity in Actin7-silenced plants and control plants. Autophagic activity in TRV alone plants without E-64d treatment was set to 1.0. More than 200 cells were quantified in each treatment. Values are means ± SE from 4 independent experiments. Student’s t test was performed to indicate significant difference (* 0.01 < p < 0.05, ** 0.001 < p < 0.01). (d) Representative TEM images of autophagic bodies in Actin7-silenced plants and control plants. Red arrowheads indicate the autophagic bodies inside the vacuole containing SER or RER. V, vacuole. Cp, chloroplast. SER, smooth ER. RER, rough ER. (e) Relative autophagic activity in Actin7-silenced plants was normalized to that of TRV alone plants. Approximately 30 cells were quantified in each treatment. Student’s t test was performed to indicate significant difference (* 0.01 < p < 0.05).
