
Figure 3.
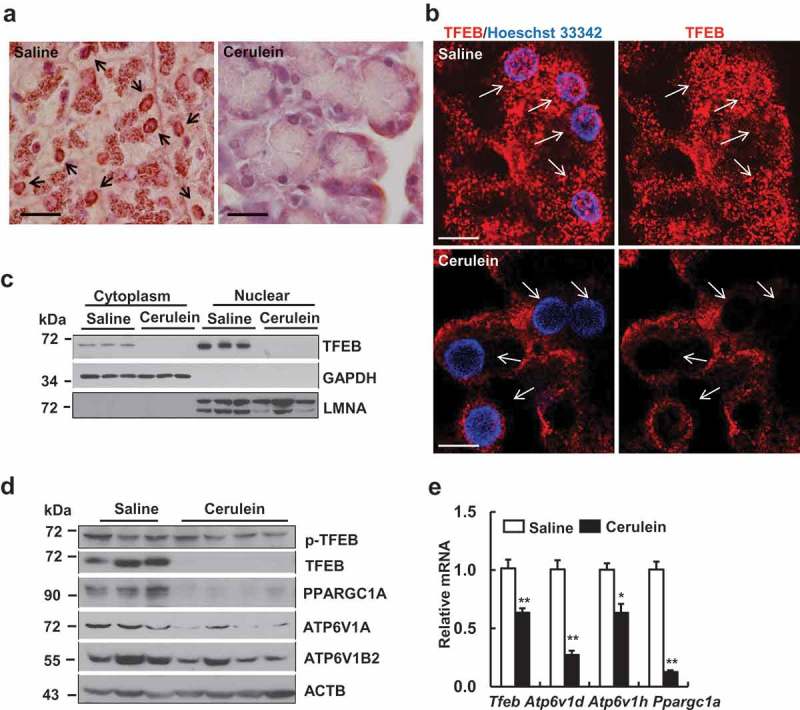
Cerulein inactivates TFEB in mouse pancreas. Male C57BL/6J mice were injected 7 hourly with cerulein (50 μg/kg) or saline. (a) Representative images of immunohistochemical staining of TFEB in mouse pancreas are shown. Arrows denote the nuclear TFEB. Bar: 50 µm. (b) Immunofluorescence analysis of TFEB staining using cryo-pancreatic tissues. Nuclei were stained with Hoechst33342. Arrows denote nuclear staining of TFEB. Bar: 20 µm. (c) Immunoblotting analysis using cytoplasmic and nuclear fractions from pancreatic tissues. (d) Immunoblotting analysis using total lysates from pancreatic tissues. (e) Pancreatic RNA was extracted followed by qPCR analysis. Results were normalized to Rn18s and expressed as fold change compared to control group. Data shown are mean ± SE (n = 4–6). *p < 0.05; **p < 0,01; Student t-test analysis.