
Figure 6.
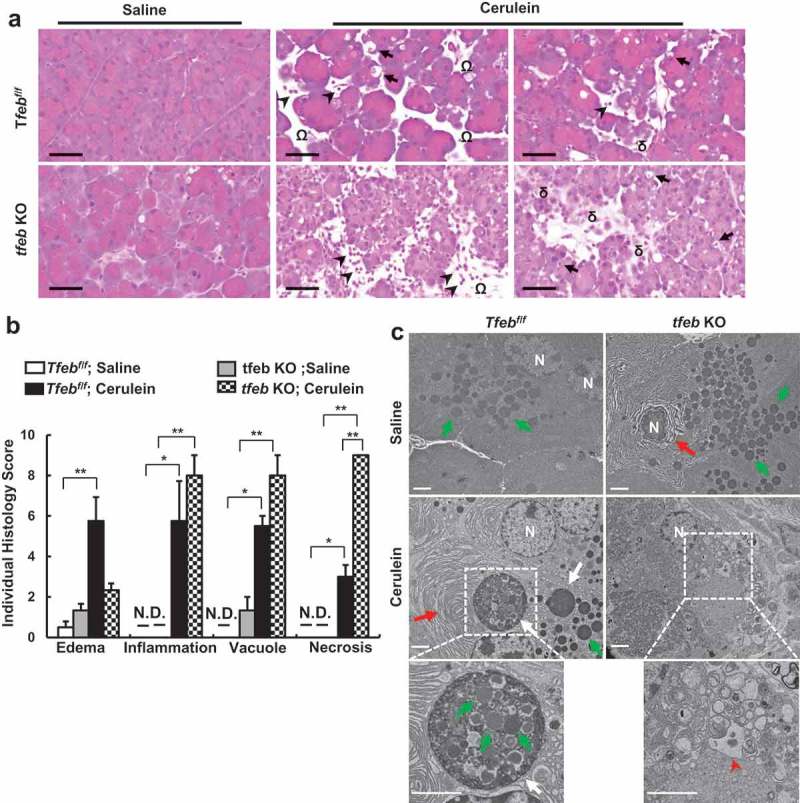
Acinar cell-specific tfeb knockout mice exacerbate cerulein-induced pancreatitis. BAC-Ela-Cre−; Tfebf/f (Tfebf/f) and BAC-Ela-Cre+; Tfebf/f (tfeb KO) mice were injected with tamoxifen (75 mg/kg) once a day for consecutive 5 days. Five days later after the last injection, these mice were further treated with 7-hourly injections of cerulein (20 μg/kg). (a) Representative images of H&E staining are shown. Arrows denote for acinar cells with vacuoles; arrow heads denote for infiltrated inflammatory cells, omega denotes for edema and delta denotes for necrosis. Bar: 50 μm. (b) Individual histology score was graded and data are mean ± SE (n = 3–4). *p < 0.05; **p < 0.01; One-way ANOVA analysis. (c) Representative EM images of pancreatic tissues are shown. Lower panels are enlarged photographs from the boxed areas. White arrows: autolysosome, green arrows: ZG; red arrows: ER; arrow heads: disrupted organelles. Bar: 2 µm.