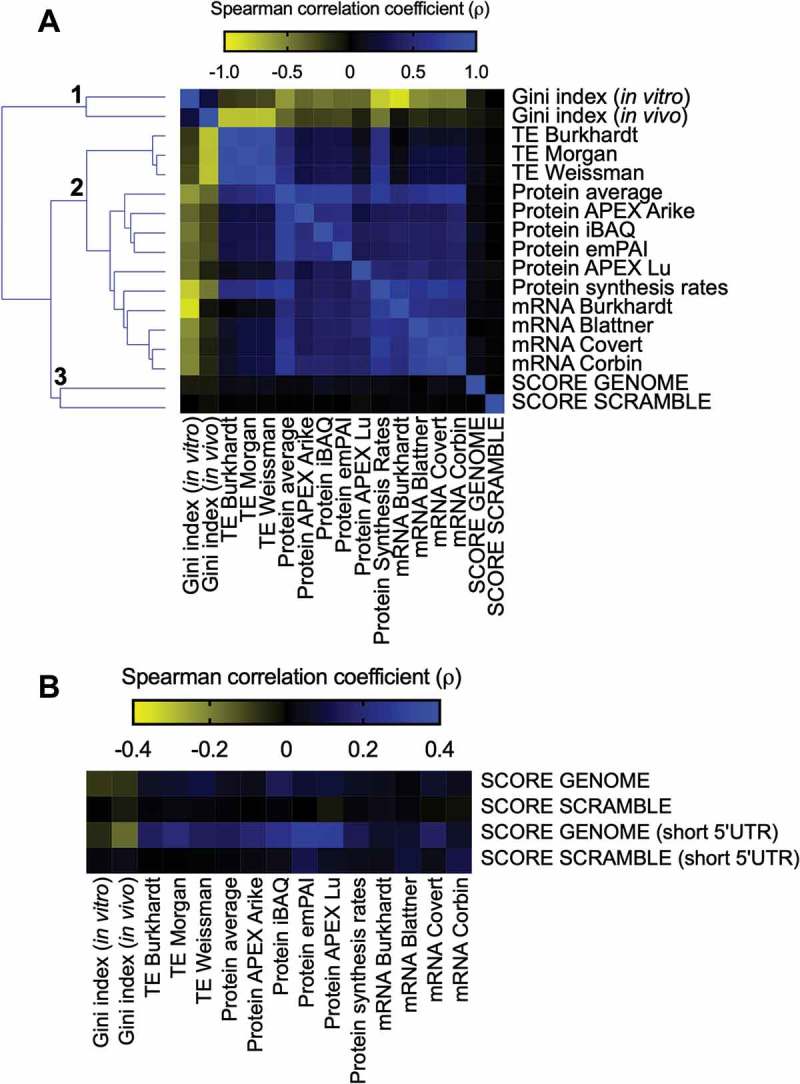
Figure 2.

E. coli individual gene score calculation and its relationship with different parameters involved with gene expression. (A) Spearman’s correlation between the E. coli score derived from the GFP library dataset (SCORE GENOME) with different cellular parameters: Gini index, TE, protein abundance, protein synthesis rates, and mRNA abundance. The heat map shows Spearman’s correlation coefficient (ρ) values ranging from −0.88 (negative correlation, yellow panels) to 1.0 (positive correlation, blue panels). Spearman’s correlation coefficient (ρ) values of the GFP score with other parameters ranging from −0.08 to 0.13. As a control, we used an E. coli scrambled genome to calculate the GFP score (SCORE SCRAMBLE). (B) The same analysis described in panel A was performed with a group of genes with short 5ʹ UTRs (< 25 nucleotides).
