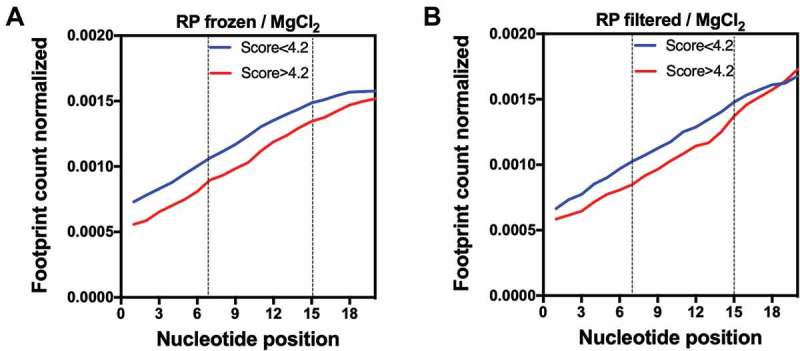
Figure 4.

Ribosome occupancy at the first 20 nucleotides of genes with GFP scores higher than 4.2 at codon positions 3–5 (nucleotides 7–15) are lower when compared to other genes. The average ribosome footprint counts of each group were obtained from ribosome profiling (RP) libraries of differently treated samples: frozen/MgCl2 (A) or filtered/MgCl2 (B) [33]. For each gene, the number of reads per base was normalized to the total number of reads.
