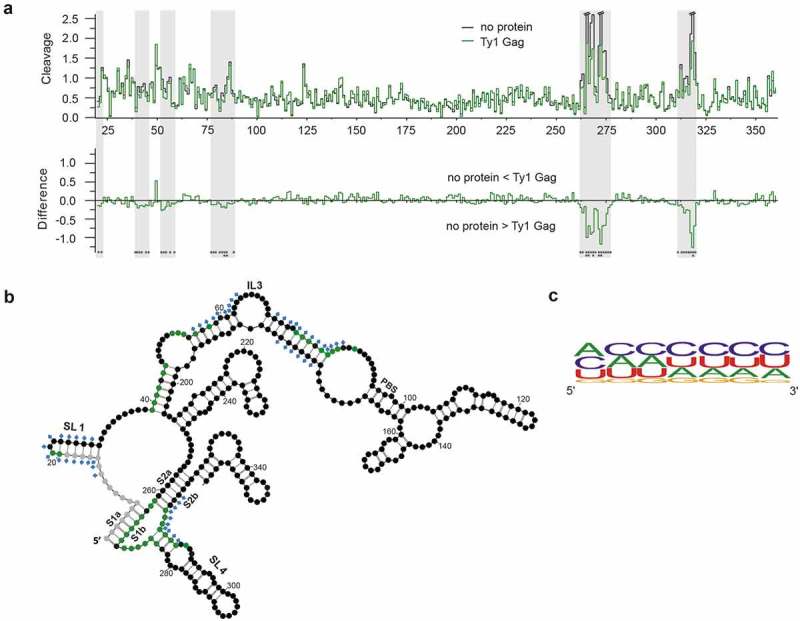
Figure 3.

Gag-p45 binding sites in mini Ty1 RNA. (A) Hydroxyl radical (HR) cleavage and difference plot analyses of protein free mini Ty1 RNA in comparison with RNA probed in the presence of Gag-p45. Regions showing statistically significant decrease HR reactivity over several nucleotides are indicated by gray stripes (absolute cleavage decrease of 0.1 or greater and a p-value <0.05). Sites of decreased HR cleavage upon Gag-p45 binding are indicated by negative peaks. Asterisks below the plot correspond to statistical significance (Student’s t-test). (B) 2D structure model of +1–358 region of mini Ty1 RNA with the positions protected from HR cleavage in the presence of Gag-p45 coloured with green (absolute cleavage decrease of 0.1 or greater and a p-value <0.05). Not analysed nucleotides are marked with gray. Nucleotide positions which most likely correspond to protein binding sites within the Ty1 genomic RNA in VLPs are marked with blue diamonds [46]. Tables with HR footprinting data are provided in Supplementary Data set 2. (C) Frequency of nucleotide occurrence within Gag-p45 binding sites and their vicinities represented as a logo (https://weblogo.berkeley.edu/).
