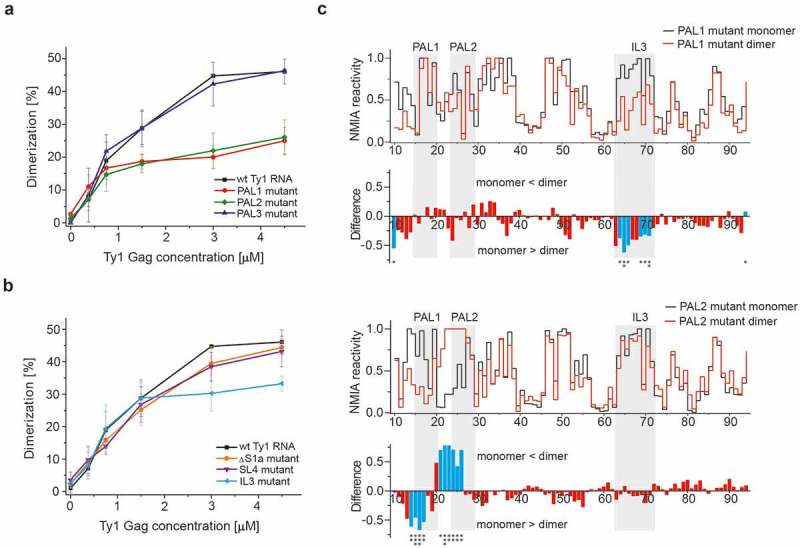
Figure 6.

Identification of cis-acting sequences important for mini Ty1 RNA dimerization. (a) Dimerization assays for wild type mini Ty1 RNA and PAL1, PAL2, PAL3 mutants. (b) Dimerization assays for wild type mini Ty1 RNA and ∆S1a, SL4 and IL3 mutants. The graphs represent averaged measurements from three independent experiments. (c) SHAPE analysis of PAL1 and PAL2 RNA mutants in monomeric and dimeric states. For clarity, the plots show the +10–90 region of mini Ty1 RNA mutants. At the top is the step plot of NMIA reactivity for monomeric (black) and dimeric (red) RNA. At the bottom is the difference plot calculated by subtracting the monomer intensities from those of the dimer. Negative values indicate nucleotides that are less flexible in the dimer. Columns corresponding to nucleotides that exhibit statistically significant differential reactivity (10% of highest SHAPE reactivity differences and a p-value <0.05 using the Student’s t-test) are coloured in blue. Asterisks below the plot correspond to statistical significance. Tables with SHAPE data are provided in Supplementary Data set 2.
