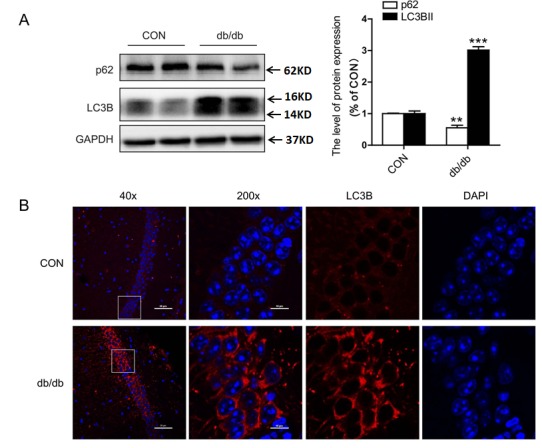
Figure 4.

The expression levels of LC3B and P62 in the hippocampus. (A) Western blot and quantitative analysis of LC3B and P62 expression. (B) Immunofluorescence staining of LC3B in CA1. CON: control. Scale bar = 50 µm and 10 µm. **p < 0.01 vs. CON, ***p <0.001 vs. CON, and N = 6.
