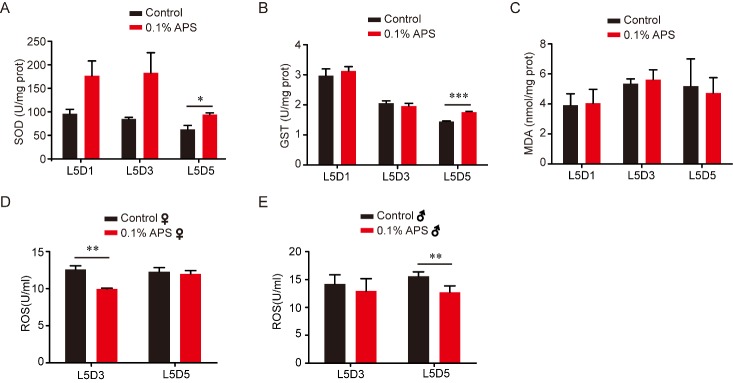
Figure 4.
Effects of APS on SOD and GST activity, and the content of MDA and ROS in the silkworm. (A) The standard curves of the SOD, the SOD activity of the fifth larval silkworm after 0.1% APS chronically treatment, L5D1 (Student’s t-test, two-tailed, n=9), L5D3 (Student’s t-test, two-tailed, n=9), L5D5 (Student’s t-test, two-tailed, n=9). (B) The standard curves of the GST, the GST activity of the fifth larval silkworm after 0.1% APS chronically treatment, L5D1 (Student’s t-test, two-tailed, n=9), L5D3 (Student’s t-test, two-tailed, n=9), L5D5 (Student’s t-test, two-tailed, n=9). (C) The standard curves of the MDA, the MDA content of the fifth larval silkworm after 0.1% APS chronically treatment, L5D1 (Student’s t-test, two-tailed, n=9), L5D3 (Student’s t-test, two-tailed, n=9), L5D5 (Student’s t-test, two-tailed, n=9). (D-E) The ROS content of the fifth larval silkworm after 0.1% APS chronically treatment, L5D3 (Student’s t-test, two-tailed, n=9), L5D5 (Student’s t-test, two-tailed, n=9).

