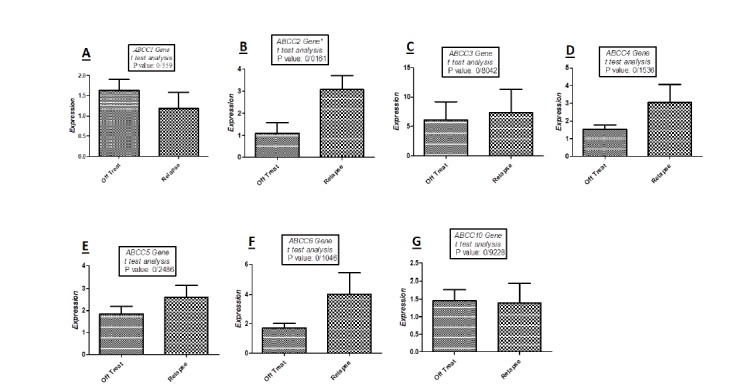
Fig. 1.

Quantitative real-time PCR analysis with t-test for the mRNAs expression levels of ABCC transporter genes in two groups of relapse and off treatment (3 years progression free survival) patients:
A: low expression of ABCC1 in relapse group in comparison to off treatment patients (P-Value: 0.359);
B: high expression of ABCC2 in relapse group in comparison to off treatment patients (P-Value: 0.0161);
C: high expression of ABCC3 in relapse group in comparison to off treatment patients (P-Value: 0.8042);
D: high expression of ABCC4 in relapse group in comparison to off treatment patients (P-Value: 0.1536);
E: high expression of ABCC5 in relapse group in comparison to off treatment patients (P-Value: 0.2486);
F: high expression of ABCC6 in relapse group in comparison to off treatment patients (P-Value: 0.1046);
G: low expression of ABCC10 in relapse group in comparison to off treatment patients (P-Value: 0.9228)
