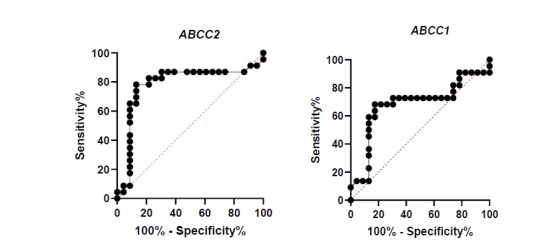
Fig. 2.

ROC curves of ABCC1 and ABCC2 expression for evaluation of sensitivity and specificity in patients:
A: high sensitivity between low expression of ABCC1 and occurrence of relapse in considered patients;
B: high sensitivity between high expression of ABCC2 and occurrence of relapse in considered patients
