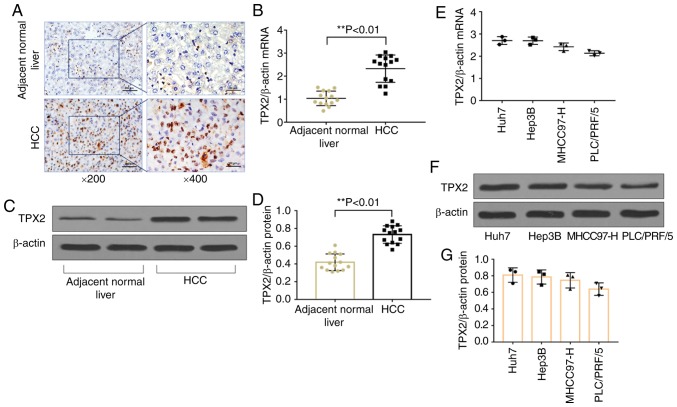
Figure 1.
TPX2 expression levels in HCC tissues and liver cancer cell lines. (A) Representative immunohistochemical stain of TPX2 expression in patients' tissues. (B) mRNA expression levels of TPX2 in HCC tissues and the adjacent normal liver tissue. **P<0.01. (C) Representative western blot of TPX2 protein expression levels in HCC tissues and the adjacent normal liver tissue. (D) Densitometry analysis of TPX2 protein expression levels in (C). **P<0.01. (E) mRNA and (F) protein expression levels in the liver cancer cell lines, Huh7, Hep3B, MHCC97-H, PLC/PRF/5. (G) Densitometric analysis of TPX2 protein expression levels in (F). Data are presented as the mean ± standard deviation. HCC, hepatocellular carcinoma; TPX2, targeting protein for Xenopus kinesin-like protein 2.

