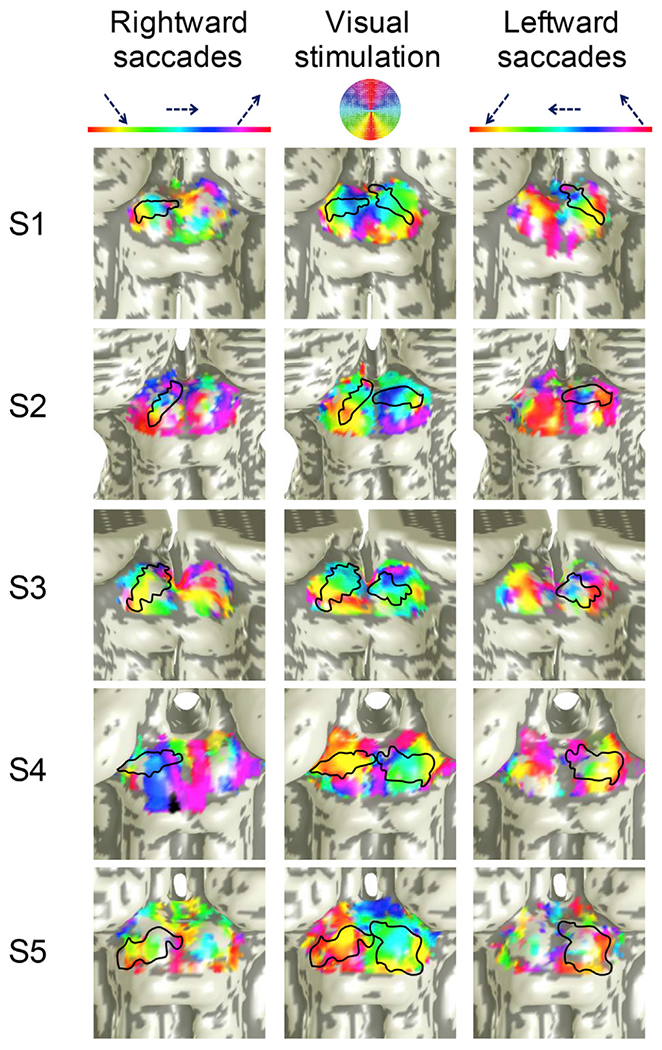
Fig. 4.

Saccadic eye movements along the superior-inferior visual field were mapped medial-laterally on the contralateral SC in five participants. From left to right, the columns of SC surfaces show phase progressions of rightward saccades (left SC), retinotopic mappings, and leftward saccades (right SC). Regions outlined in black show the optimally defined elliptical ROIs on each SC. The elliptical ROIs are also shown on the retinotopy for comparison. (See Fig. S4 for cortical analyses). Note that the color map for the polar-angle retinotopy overlay has been adjusted to match that used for the saccade experiments.
