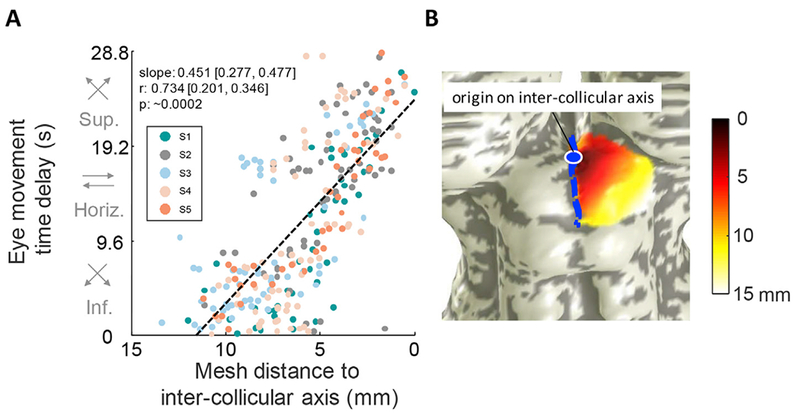
Fig. 5.

Saccadic eye-movement phase increases medially, revealing saccades made superiorly are mapped medially. A. The phase of all active vertices (p < .2) is plotted against mesh distance from inter-collicular axis for all participants combined, revealing the lateral-medial mapping of eye-movements along the inferior-superior visual axis. Correlation metrics are listed, with 68% confidence interval ranges of slope and correlation values listed, as well as bootstrapped p-values. B. Representative participant illustrates mesh distance on a surface SC (data from participant S2). The mesh distance was computed from a vertex along the inter-collicular axis. Data are pooled from all participants and all sessions, totaling 6 sessions from the left SC and 6 sessions from the right SC. (See Fig. S3 for individual participant correlations).
