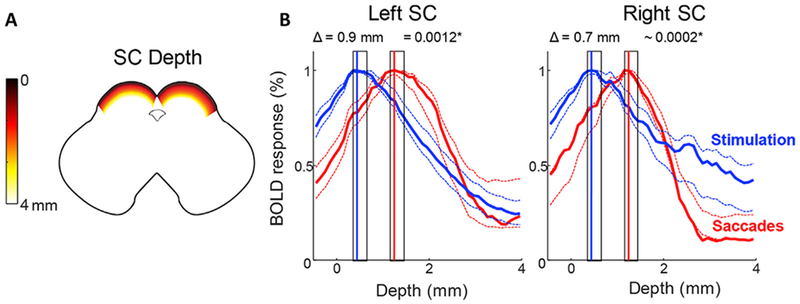
Fig. 7.

Saccadic eye movement maps lie deeper in SC than visual stimulation maps. A. Graphic illustrating depth of SC in a horizontal cross section. B. Laminar depth profiles for both left and right SC show the activity evoked by saccades (red) lies deeper in SC than activity evoked by visual stimulation (blue). Data are combined across all 5 participants for left and right SC. Dotted lines represent 68% confidence intervals bootstrapped across all runs and participants. The peak is significantly shifted deeper for saccades for both left and right SC (shaded rectangles show bootstrapped 68% confidence intervals for centroid calculations). (See Fig. S6 for individual participant depth profiles).
