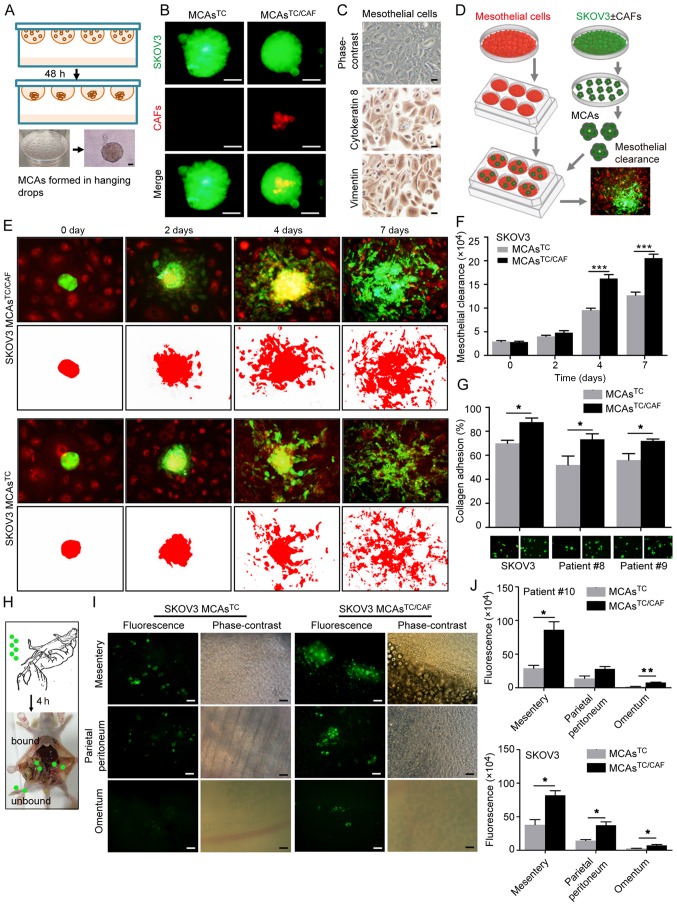
Figure 4.
MCAsTC/CAF have a higher invasive capacity than MCAsTC. (A) Schematic diagram of MCA formation in hanging drops. (B) MCAsTC/CAF and MCAsTC morphology by fluorescence microscope. CAFs and SKOV3 cells were labeled with FM4-64 (red) and GFP (green), respectively. Scale bar, 50 µm. (C) Identification of primary mesothelial cells. Mesothelial cells are cytokeratin 8- and vimentin-positive. Scale bars, 50 µm. (D) Schematic diagram of mesothelial clearance assays. (E) Representative images of mesothelial clearance assays with SKOV3 MCAsTC/CAF and MCAsTC at 0, 2, 4 and 7 days. Mesothelial cells and SKOV3 cells were labeled with FM4-64 (red) and GFP (green), respectively. (F) Histograms show that SKOV3 MCAsTC/CAF have a stronger mesothelial clearance ability than SKOV3 MCAsTC. (G) In vitro adhesion assays. Histograms show that MCAsTC/CAF have a stronger collagen adhesion capacity than MCAsTC. (H) Schematic diagram of adhesion assays in vivo. MCAs were intraperitoneally injected into mice (N=3/group). After 4 h, the mice were sacrificed and the tumor cells bound to the peritoneum were evaluated under a microscope. (I) Representative images of adhesion assays in vivo. Tumor cell attachment to the mesentery, parietal peritoneum and omentum. (J) Histograms show the differences in tumor cell florescence intensity in the mesentery, parietal peritoneum, and omentum between groups. *P<0.05, **P<0.01 and ***P<0.001. MCA, multicellular aggregate; CAFs, cancer-associated fibroblasts; TC, tumor cell; GFP, green fluorescent protein.

