Figure 1.
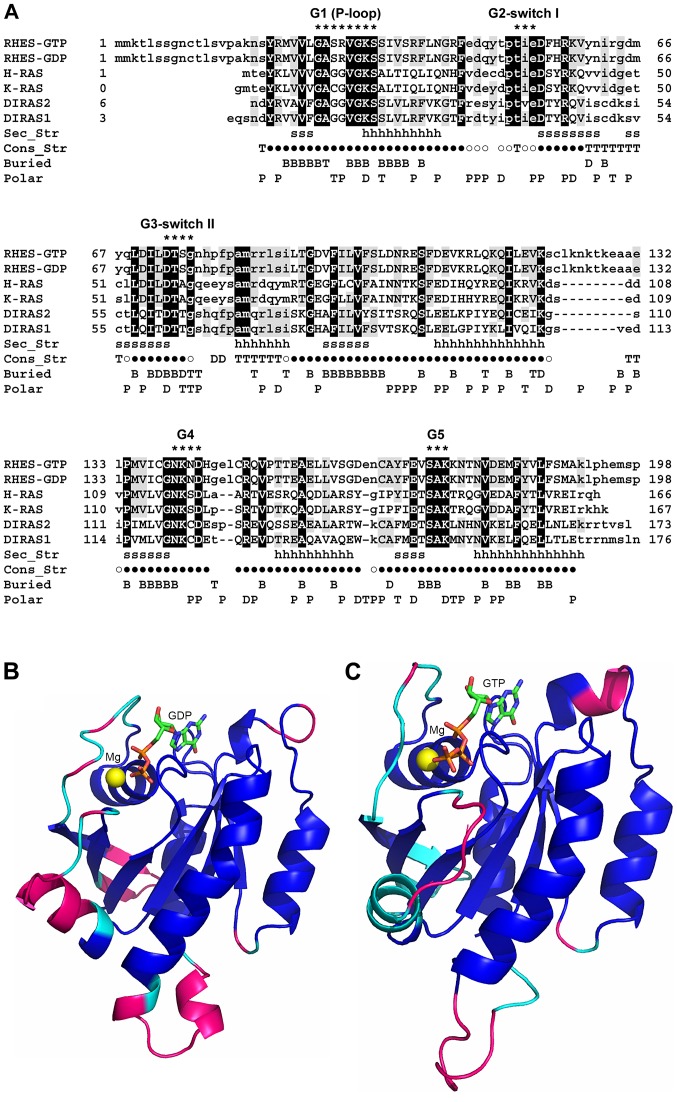
Sequence and structure comparison between RHES and homologous proteins belonging to the Ras family. (A) SB-MSA of RHES 3D models with proteins of known structure bound to either GTP or GDP. Both RHES-GTP and RHES-GDP models were included in the SB-MSA. RHES sequence is truncated at residue 198, since the remaining C-terminal region (199-253) does not have homologs of known structure. Other sequences comprise only residues that are visible in the experimentally determined 3D structures (Table I). Upper- and lower-case letters indicate residues that are and are not structurally aligned, respectively. Black and grey background shows RHES residues whose identity is conserved in all or at least one template, respectively. Sec_Str: Secondary structure elements, i.e., β strands and α-helices, which are present in both GTP and GDP-binding H-Ras structures, are marked with 's' and 'h' letters, respectively. Con_Str: Residues that are structurally conserved between all the experimentally determined structures are indicated by '●' symbols; 'T', 'D' and '○' symbols indicate residues that are structurally conserved between GTP-bound H-Ras and Rap1A, GDP-bound H-Ras and DiRas2, and both the aforementioned pairs of structures, respectively. Buried: Residues whose SASA is ≤20 Å in RHES-GTP model, RHES-GDP model and both models are indicated with 'T', 'D' and 'B', respectively. Polar: Residues whose SASA in RHES-GTP model, RHES-GDP model and both models are predominantly polar, are indicated with 'P', 'T' and 'D', respectively. Residues belonging to conserved RAS family motifs G1-G5 are indicated by '*'. The consensus sequences of these motifs are: G1 (P-loop) = GXXXXGK(S/T); G2 switch I = XTX; G3 switch II = DXXG; G4 = (N/T)(K/Q)XD; G5 = (T/G/C)(C/S)A. (B) Molecular model of RHES-GDP. The model is represented as a ribbon and colour coded as follows. Blue: Residues that are structurally conserved among GTP- and GDP-bound structures, indicated by a '●' symbol in panel (A). Cyan: Additional residues that are structurally conserved between GDP-bound structures, indicated by '○' and 'D' symbols in panel (A). Magenta: Residues that are not structurally conserved in either of the aforementioned groups of structures. GDP is shown as sticks and coloured by atom type (C, green; N, blue; O, red; P, orange). The magnesium ion is shown as a sphere and coloured yellow. (C) Molecular model of RHES-GTP. The model is represented as a ribbon and colour coded as follows. Blue: Same as in panel (B). Cyan: Additional residues that are structurally conserved between GTP-bound structures, indicated by '○' and 'T' symbols in panel (A). Magenta: Residues that are not structurally conserved in either of the aforementioned groups of structures. GTP is shown as sticks and coloured by atom type (C, green; N, blue; O, red; P, orange). The magnesium ion is shown as a sphere and coloured yellow. RHES, Ras Homolog Enriched in Striatum; SB-MSA, Structure-Based-Multiple Sequence Alignments; GTP, guanosine triphosphate; GDP, guanosine diphosphatase.

