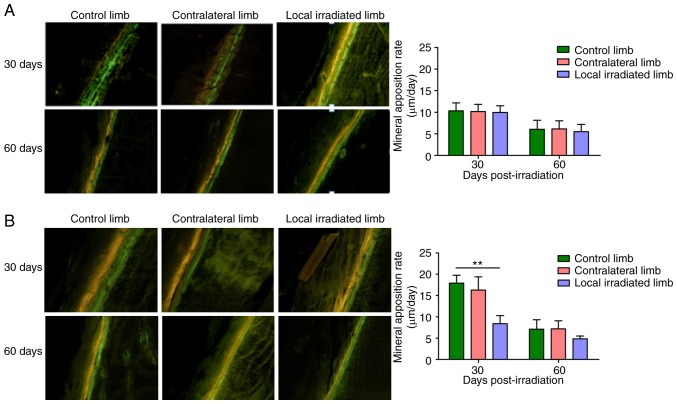
Figure 5.
Representative tetracycline hydrochloride and calcein double-labeling in the midshaft and dynamic histomorphometric analysis quantifying mineral apposition rate (µm/day) in the irradiated and contralateral femur relative to control mice at 30 and 60 days post-irradiation. (A) Single 2 Gy local irradiation. (B) 3x8 Gy local irradiation. Magnification, x100. The yellow and green fluorescent lines indicate labeled tetracycline hydrochloride and calcein, respectively. Mineral apposition rate (µm/day) = double fluorescence line spacing/days between the two lines. **P<0.01 control vs. irradiated limb.

