. 2019 Oct 9;8:e47021. doi: 10.7554/eLife.47021

Figure 2. Differences in task-related CF signals between AldC+ and AldC− compartments.

(A) Schematic diagram of virus injection into the left cerebellar folium Crus II of Aldoc-tdTomato mice. Inset, magnified view of the Crus II. Red stripes represent AldC+ compartments. (B) Left, tdTomato fluorescence image at a 5−/5+ boundary. Middle, mean image of a GCaMP6f video at the same field of view. Right, extracted ROIs representing PC dendrites that are pseudocolored, in the same field of view. Scale bars, 40 μm. (C) Representative calcium traces from dendrites in panel (B) and their corresponding lick activities (black bars). Colored vertical lines represent the onsets of sensory cues for each trial type. (D) Trial-averaged calcium traces of single ROIs from the data in panel (C). (E) Single ROI trial-averaged traces for 5− and 5+ compartments from the data in panel (C). Thick lines represent ROI-averaged traces. (F) Percentage of responsive ROIs in a compartment per session for each trial type pooled across all AldC+ or AldC− compartments (n = 17 mice, 79 imaging sessions). Colored circles represent means. Colors represent trial types (hit, magenta; FA, green; CR, blue). Two-way ANOVA on ranks with repeated measures followed by post-hoc Tukey’s test: ***p<0.001.

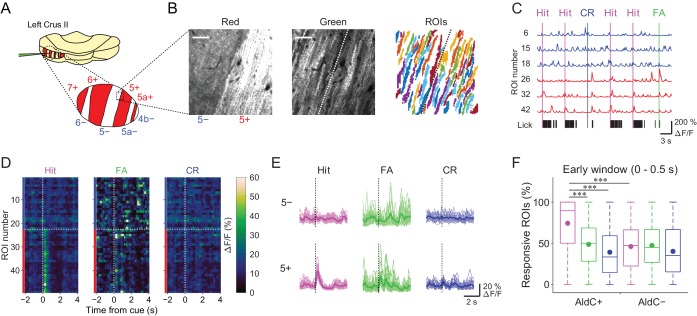
Figure 2—source data 1. Datasets used to create Figure 2.
DOI: 10.7554/eLife.47021.015

Figure 2.

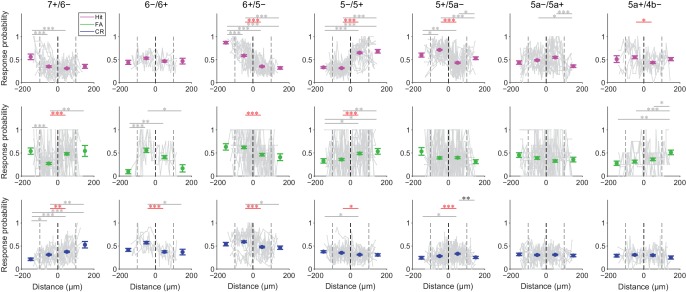
Figure 2—figure supplement 1. Broad correspondence between functional boundaries and AldC expression boundaries at the microzone level.

Figure 2—figure supplement 1.

Probability of response during the early response window (0 to 0.5 s from cue onset) in single ROIs (gray dots) for each trial type (hit, magenta; FA, green; CR, blue) plotted as a function of relative distance from AldC expression boundaries (gray lines; single lines represent single imaging sessions). Colored dots and error bars represent the means and s.e.m. of single ROI response probability within 100 µm bins from AldC expression boundaries, pooled across sessions and animals (lateral 100–200 μm bin, lateral 0–100 μm bin, medial 0–100 μm bin, and medial 100–200 μm bin; 7+/6−, n = 5 mice, 12 imaging sessions, 18, 147, 147, and 11 ROIs; 6−/6+, n = 3 mice, four imaging sessions, 8, 48, 40, and 6 ROIs; 6+/5−, n = 8 mice, 13 imaging sessions, 19, 140, 143, and 23 ROIs; 5−/5+, n = 9 mice, 15 imaging sessions, 34, 199, 161, and 33 ROIs; 5+/5a−, n = 8 mice, 16 imaging sessions, 21, 168, 209, and 37 ROIs; 5a−/5a+, n = 3 mice, 13 imaging sessions, 35, 159, 159, and 26 ROIs; 5a+/4b−, n = 2 mice, six imaging sessions, 13, 69, 74, and 23 ROIs). Red horizontal lines and asterisks represent significant difference between adjacent 100 μm bins across AldC expression boundaries. Gray horizontal lines and asterisks represent significant difference between the other pairs of 100 μm bins. Black vertical dashed lines represent AldC expression boundaries. Gray vertical dashed lines represent other boundaries between 100 μm bins. One-way ANOVA on ranks with repeated measures followed by post-hoc Tukey’s test: *p<0.05, **p<0.01, ***p<0.001.
Figure 2—figure supplement 1—source data 1. Datasets used to create Figure 2—figure supplement 1.
DOI: 10.7554/eLife.47021.010
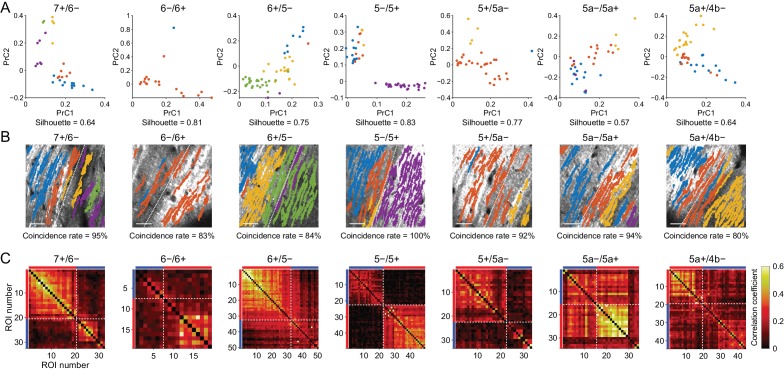
Figure 2—figure supplement 2. Broad correspondence between functional boundaries and AldC expression boundaries at cellular resolution.

Figure 2—figure supplement 2.

(A) Principal component analyses of whole ∆F/F traces from all ROIs in single imaging sessions at all AldC expression boundaries, irrespective of AldC expression. Colored dots correspond to results from k-means clustering on the basis of the first three principal components (PrC1, PrC2, and PrC3). The first two major principal components (PrC1 and PrC2) for individual ROIs are plotted for better visualization. The silhouette value for the optimized cluster number is indicated on the bottom. (B) Projections of each clustering result from panel (A) using the same color scheme, overlaid on the tdTomato image. Coincidence rates of clustering results and AldC expression are indicated at the bottom. Scale bars: 40 μm. (C) Correlation matrices of whole traces from all the ROIs in panel (B) aligned from lateral to medial. Red and blue bars correspond to AldC+ and AldC− PCs. Note the exact delineation of the correlation matrices at the AldC expression boundary where coincidence value is close to 100%. (B, C) White dashed lines represent boundaries of AldC expression.
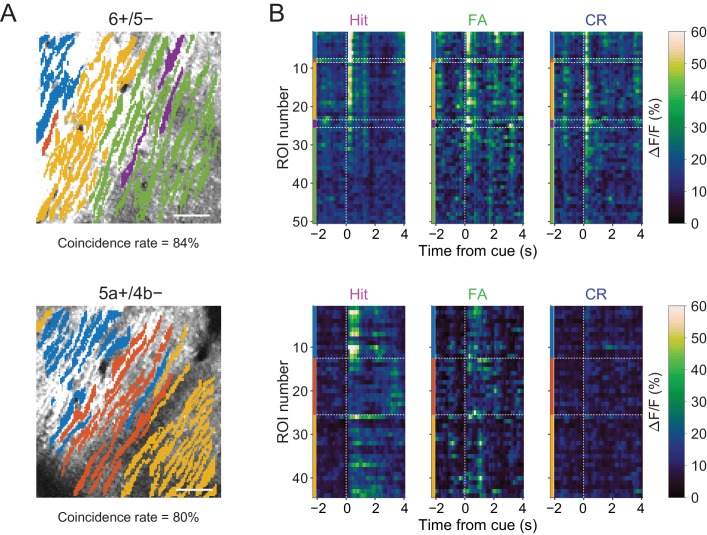
Figure 2—figure supplement 3. Task-related CF signals in individual clusters.

Figure 2—figure supplement 3.

(A) Projection of clustering results of Figure 2—figure supplement 2A overlaid on tdTomato images at 6+/5− (top) and 5a+/4b− (bottom) boundaries. Coincidence rates of clustering results and AldC expression are indicated below the images. (B) Trial-averaged single ROI calcium traces separated on the basis of clustering results. Colored bars indicate ROIs from colored clusters in panel (A). Horizontal dashed lines represent the boundaries of clusters. Vertical dashed lines represent cue onsets.
Figure 2—figure supplement 4. Summary of correspondence between functional boundaries and AldC expression.

Figure 2—figure supplement 4.

(A) Number of clusters per field of view for all sessions from all mice (n = 5, 3, 8, 9, 8, 3, and two mice, 12, 4, 13, 15, 16, 13, and 6 sessions for 7+/6−, 6−/6+, 6+/5−, 5−/5+, 5+/5a−, 5a−/5a+, and 5a+/4b− boundaries, respectively). (B) Same as in panel (A), but for silhouette values for the clustering results. (C) Same as in panel (A), but for coincidence rates for the clustering results. One-way ANOVA on ranks with repeated measures followed by post-hoc Tukey’s test: *p<0.05.
Figure 2—figure supplement 4—source data 1. Datasets used to create Figure 2—figure supplement 4.
DOI: 10.7554/eLife.47021.014