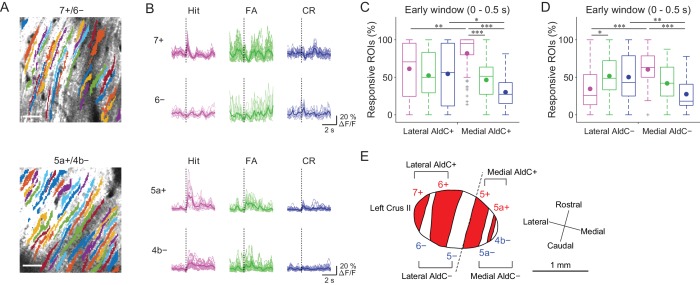
Figure 3. Difference in CF signals between the lateral and medial Crus II.
(A) Extracted ROIs representing PC dendrites that are pseudocolored overlaid on the tdTomato image around a 7+/6− (top) and a 5a+/4b− (bottom) boundary. Scale bars, 40 μm. (B) Single ROI trial-averaged traces for 7+ and 6− (top) and 5a+ and 4b− (bottom) compartments from the data in panel (A). Thick lines represent ROI-averaged traces. (C) Percentage of responsive ROIs during the early response window (0 to 0.5 s from cue onset) in an AldC compartment per session for each trial type pooled across all the lateral AldC+ or medial AldC+ compartments (n = 12 and 13 mice, 29 and 50 imaging sessions, respectively). Colored dots represent means. Colors represent trial types (hit, magenta; FA, green; CR, blue). (D) Same as panel (C) but for all the lateral AldC− or medial AldC− compartments (n = 15 and 9 mice, 44 and 35 imaging sessions, respectively). (E) Schematic diagram of the left Crus II showing a functional grouping of AldC compartments. The dashed line represents a boundary between the lateral and medial Crus II. (C, D) Two-way ANOVA on ranks with repeated measures followed by post-hoc Tukey’s test: *p<0.05, **p<0.01, ***p<0.001.


