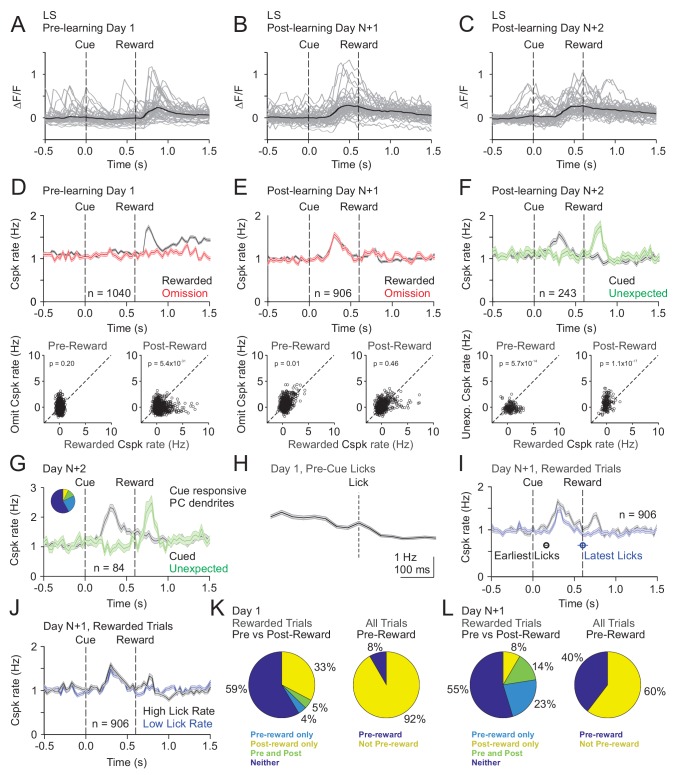
Figure 3. Cspk modulation in LS across learning.
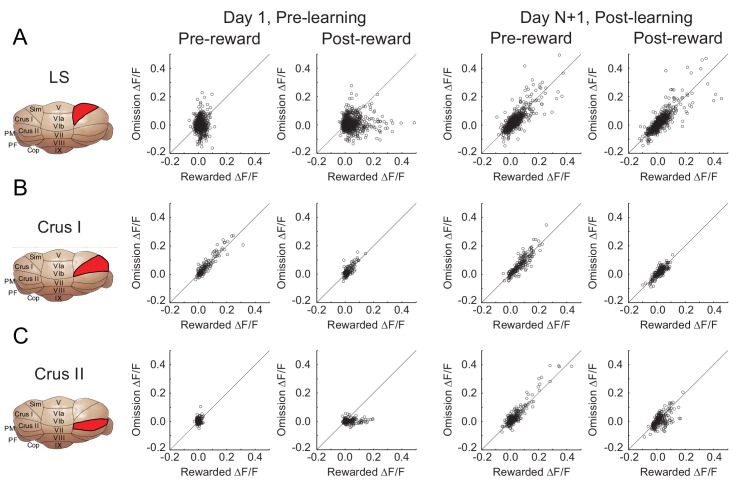
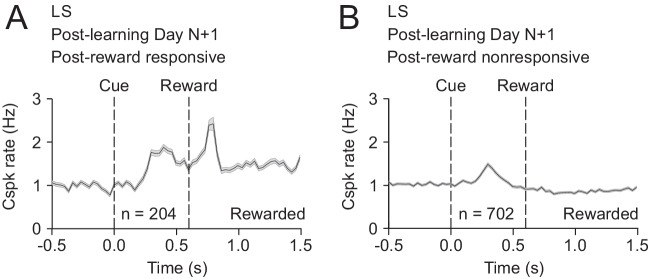
(A) ΔF/F timecourses from an example neuron measured via two-photon calcium imaging for the first day of training in naïve mice. Gray traces are the first 50 trials and the black trace is the average of those 50 trials. (B) Same as (A), but on post-learning day N+1. (C) Same as (A,B) but for post-learning day N+2. (D) Top, mean cue-aligned peri-stimulus histograms (PSTHs) of Cspk rate on reward (black) and omission (red) trials for all PC dendrites on the first day of training in naïve mice. Bottom, summary scatterplot comparing the Cspk rate for individual PCs on rewarded vs omission trials in naïve mice. Spike rates were measured in a window preceding reward delivery (left) or immediately after reward delivery (right) (Materials and methods). (E) Same as D), but for rewarded and reward omission trials on post-learning day N+1 (F) Same as (D,E), but for rewarded and unexpected reward trials on post-learning day N+2. (G) Mean cue-aligned PSTH for PC dendrites that exhibited Cspk responses to the visual cue. Inset: fraction of the total dendrites on Day N+2 that responded in the pre-reward window on rewarded trials only (light blue, 24%), the post-reward window on unexpected reward trials only (yellow, 7%), both pre and post reward windows on rewarded and unexpected reward trials respectively (green, 10%), and neither window (blue, 58%). (H) Mean lick-triggered PSTH for licks during the inter-trial interval (ITI) in naïve animals. (I) Mean cue-aligned PSTHs for trained animals with rewarded trials segregated according to trials with the earlies 1/4 of licks (black, 162 ± 19 ms from cue) and latest 1/4 of licks (blue, 604 ± 64 ms from cue). (J) Mean cue-aligned PSTHs for trained animals with rewarded trials segregated according to trials with the highest 1/4 of lick rates (black, 5.4 ± 0.1 Hz) and the lowest 1/4 of lick rates (blue, 2.6 ± 0.1 Hz). (K) Fraction of all lobule simplex neurons which were responsive to specific task events on the first day of training for rewarded trials (left) and all trials (right). (L) Same as (K) but for training day N+1. Data points with horizontal error bars represent the mean lick timing ± SEM. For all PSTHs, shaded area represents ± SEM across dendrites.


